
Clinical Evaluation and Validation of A New Brain Oxygen Saturation Monitoring Instrument
ABSTRACT
Background: The human brain is highly sensitive to ischemia and hypoxia which may lead to irreversible brain tissue damage,
and the standard monitoring methods of systemic arterial and venous oxygen saturation may not represent the oxygenation state
in the brain. Hence, maintenance of adequate cerebral oxygenation is mandatory to ensure safety and prevent decreased cerebral
perfusion and cerebral tissue ischemia. The blood samples of the jugular vein and radial artery are obtained, and their oxygen
saturation levels are measured. Further, using the clinical empirical formula Sa/vO2 = 0.7×S jvO2 + 0.3×SaO2, the oxygen saturation
value of brain tissue for invasive blood gas analysis can be calculated. In this study, the consistency of brain oxygen saturation
(rSO2) was measured by two analyzers, the brain oxygen saturation monitor (hereinafter referred to as brain oxygen analyzer) and
brain oxygen saturation (Sa/vO2) measured by invasive blood gas analysis were evaluated to calculate the accuracy of brain oxygen
saturation monitoring.
Methods: In healthy adult volunteers, the induced desaturation test, in which blood gas analysis measures the subjects’ internal
jugular vein and radial artery blood samples at each pulse oximetry platform range. Clinical trials were conducted to verify the
expected effectiveness and safety of the brain oxygen saturation monitor. Ten subjects were selected for the study according to strict
inclusion and exclusion criteria. Subjects should monitor their electrocardiogram, pulse, blood pressure, SPO2, and other vital signs,
A retrograde puncture catheterization of the internal jugular vein and radial artery catheterization were performed to ensure the
safety of subjects during the period and record the values of blood samples before and after collection. The oxygen was lowered
according to the set platform, and physiological parameters were monitored during the process. There were 9 platforms in total,
and each platform lasted about 1 minute. The oxygen saturation value of the jugular vein (SJVO2) and the oxygen saturation value
of the radial artery (SaO2) were obtained, and the tissue oxygen saturation value of Sa1vO2 was calculated according to the clinical
empirical formula Sa1VO2 = 0.7xSJVO2 + 0.3xSaO2. During the blood collection process, the blood oxygen saturation (RSO2) of the
subjects’ brains was continuously monitored by the noninvasive tissue oximeter. The consistency of non-invasive monitoring value
RSO2 and invasive measurement value Sa1vO2 was compared, and scientific statistical analysis was carried out to confirm whether
the accuracy of the tissue oxygen meter meets clinical requirements.
Results: Absolute accuracy evaluation: Further linear regression analysis was performed on the non-invasive monitoring value
of the test instrument and the blood gas analysis detection value. The fitting linear equation was rSO2 = 4.89+0.93×Sa/vO2, where
the slope was 0.93, close to 1. The regression line was close to the 45° diagonal trend. The correlation coefficient between rSO2 and
Sa/vO2 was 0.95, indicating that there was a good correlation between the non-invasive monitoring value and the invasive blood
gas analysis value. Trend accuracy evaluation: It was noticed that the average difference between the trend change value of the test
instrument monitoring value and the blood gas analysis value was very small and was basically consistent in statistical significance
The 95% consistency interval of the difference of trend change between the two devices was narrow, indicating that there is a good
consistency between the non-invasive monitoring value of the test equipment and the invasive test results of the blood gas analysis
equipment. The linear regression analysis made on the changes of the test instrument monitoring value and blood gas analysis
detection value showed that the fitting linear equation was rSO2=-0.98+0.93 Sa/vO2, and the slope was 0.93, which was close to 1. The regression line was close to the 45° diagonal trend. The correlation coefficient of trend changes of the two equipment was
0.95, indicating that the changing trend of the test equipment and blood gas analyzer has a good correlation. Analyze the trend
changes value, due to the variation of every subject is relative to the first platform first blood gas analysis values as the base to
calculate, so the data points less than 10 absolute value analysis, the test equipment and the trend of blood gas analysis change the
average deviation is 0.32%, the standard deviation is 2.97%, RMS very different trend is 2.97%. The clinical evaluation standard of
trend Arms ≤5% was met.
Conclusion: There is a good correlation and consistency between the test instrument monitoring value and the absolute value
of the blood gas analyzer.
KEYWORDS
Consistency; Brain oxygen saturation; Brain oxygen saturation analyzer; Blood gas analyzer; Accuracy
INTRODUCTION
The blood oxygen saturation is an index to monitor the oxygen supply and oxygenation of human blood or local tissues. Oxygen saturation is an important physiological parameter of respiratory circulation, as well as a key reference index for the protection of vital organs in the perioperative period. Traditional blood oxygen saturation includes arterial (SAO2) and venous (SVO2) oxygen saturation, in which arterial oxygen saturation has achieved noninvasive continuous monitoring of CSpO2, that is, clinical monitoring of finger end pulse oxygen value. Brain oxygen saturation monitor is a non-invasive, continuous monitoring instrument for absolute oxygen saturation of brain tissue based on NIRS tissue oxygen parameter monitoring technology. In tissue optics, Near-Infrared Light (NIR) generally refers to Infrared Light with a wavelength of 700-900 nm, which has good penetration of human tissues and is called “Spectral Window” [1,2]. Figure 1 shows the absorption spectra of hemoglobin (HbO2), deoxyhemoglobin (HHb), and water at 650-1000 nm wavelengths [3].
The significant differences among the three can be clearly identified, and in particular, the absorption rate of water at this wavelength is much lower than HHb and HbO2 (Figure 1). Therefore, if near-infrared light with an appropriate wavelength is selected, and light with the same light intensity and different wavelength is projected onto human tissue in a certain time sequence. Moreover, the outgoing light of each wavelength is received in the same time sequence at the set position (Figure 2) and is obvious that the light intensity of each wavelength received will be different. These different light intensity signals are converted into electrical signals by a special photosensitive chip, and a series of processing such as acquisition, amplification, filtering, and calculation of these electrical signals can be obtained.
The concentrations of HHb and HbO2 in the texture or their changes over time, as well as the oxygen saturation (rSO2) of local tissues (tissues located below the sensor can be scanned by the light source on the sensor), and other information about tissue oxygenation status can be obtained. The test instrument, MOC- 100, sends different wavelengths of near-infrared light through the scalp and skull to the brain via disposable sensors on the patient’s forehead. The reflected light is captured by a detector located on the sensor for optimal signal acquisition. After analyzing the reflected light, the absolute value of brain tissue oxygen saturation is displayed on the screen and a graphical representation of the historical values is provided. Brain tissue oxygen saturation monitor (hereinafter referred to as tissue oxygen meter) can monitor the oxygenation of microcirculation vessels (mainly microveins) in tissues. The method is based on chromophore oxygenated HbO2 from human tissues. With different absorption, scattering, and reflection characteristics of HHb in the nearinfrared spectrum (660~940nm), the self-developed sensor emits non-invasive low-density near-infrared light through the patient’s cerebral cortex, cranial bone, and gray matter, and measures the reflected light received by the near and far phototube (Figure 1). Subsequently, the tissue oxygen saturation value and monitoring curve were obtained by analyzing, identifying, and calculating the light intensity signal with a unique algorithm. A tissue oxygen meter is a continuous, non-invasive device that monitors tissue oxygen saturation in real-time and reflects the balance between tissue oxygen supply and oxygen demand. Tissue oxygen saturation alerts medical staff on tissue hypoxia or hyperoxygenation events and reminds medical staff to take possible interventions to protect the normal physiological function of the patient’s vital organs and tissues.
In recent years, with the application of the noninvasive continuous near-infrared local tissue oxygen saturation monitoring instrument, digital monitoring with the continuous and noninvasive mode of data for clinical practice was achieved on brain tissue oxygen supply and real-time oxygen demand. Even though these monitoring technology of clinical advantages are more obvious, expensive instruments (more than RMB 400,000) and disposable sensors have hindered the clinical popularization and application of tissue blood oxygen parameter monitoring technology in domestic hospitals.
MATERIAL AND METHODS
Ethical Approval
After Research Ethics Board approval at Medical Ethics Committee, Zhongnan Hospital of Wuhan University, Wuhan, Hubei, P.R. China (Project approval number is 2019007, dated 28/6/2019), the study has been retrospectively registered in Chinese Clinical Trial Registration with the registration number ChiCTR2100052321, dated 24/10/2021. We conducted a prospective randomized, double-blind, controlled clinical trial from September 2019 to November 2019. This was a single-center study in the Zhongnan hospital in Wuhan, Hubei, P.R. China, and all methods used in the experiment are followed in accordance with the relevant guidelines and regulations.
Study Design and Population
Twelve subjects were enrolled in the study, among which 10 subjects successfully completed the clinical trial and 2 withdrew from the study due to personal reasons. All the 10 subjects who completed the experiment cooperated or had poor cooperation records. Subject selection (including control group selection if necessary): 1) Inclusion criteria: Healthy adults aged from 18 to 45 years old had a balanced and reasonable gender distribution; Co hemoglobin (COHb) < 3%; methemoglobin (MetHb) < 2%; ctHb > 10 g/dL; No smoking history/ No history of cardiopulmonary diseases; Those who have passed the physical examination; and the subject voluntarily signs a written informed consent to participate in the clinical trial. 2) Exclusion criteria: Smokers or those exposed to high carbon monoxide levels; Those with coagulation dysfunction or artificial blood vessels; People with the previous history of heart and lung diseases; Patients suffering from skin disease, infection, or trauma around the measurement site so that this parameter cannot be measured; Patients with mental illness, epilepsy or other diseases resulting in involuntary movement of the body; Physical condition which can lead to high methemoglobin; Subjects who are undergoing procedures that are likely to create undue medical risks for them; Pregnant women; With grey nails; all cases which the clinical trial personnel suspect that the compliance is not good and the protocol cannot be strictly implemented; Subjects who enrolled in other clinical trials within 30 days; Patients with other diseases not suitable for clinical trials; Unwilling to sign the informed consent.
Method and Time Selection for Evaluating, Recording, and Analyzing Validity Parameters
Pulse oxygen clinical range of 70-100% was considered for testing as pulse oxygen SpO2 less than 70% may lead to lifethreatening conditions. SpO2 was divided into nine platforms (Table 1), and an induced hypoxia test was conducted on the subjects. The hypoxia process was induced, and the brain oxygen saturation of the subjects changed from high to low, covering the clinical range of 50-80%. Two data groups were obtained on each gradient platform, and each data group was recorded as follows: cerebral oxygen meter value rSO2: rSO2 left 1 and rSO2 right 1 at the beginning of blood drawing and rSO2 left 2 and rSO2 right 2 at the end of blood drawing. The mean rSO2 was calculated; Blood gas analysis value Sa/vO2: SjvO2 was obtained by blood gas analysis of venous blood, and SaO2 was obtained by blood gas analysis of arterial blood. Sa/vO2 was calculated according to the formula 0.7×SjvO2+0.3×SaO2 weighted average.
Absolute accuracy of calculation was followed as defined in this clinical protocol, and if ≤10%, the brain oxygen meter can be clinically accepted as an instrument for displaying the absolute value of tissue oxygen saturation. Auxiliary Bland-Altman analysis showed the difference (rSO2(I)−Sa/vO2(I)) as percentage taken on the y-axis, and Bland-Altman plot was drawn with (rSO2i+Sa/vO2i) /2 as x-axis. The excluded data were explained to calculate the mean deviation Bs, variance S2 of the total deviation, and variance S2 of different individual deviations, and the consistency limit Bs±1.96SD was analyzed. If the accuracy of trend calculation is less than 5% (as defined in Chapter 15 of this clinical protocol), the brain oxygen meter can be clinically accepted as an instrument for displaying trends in tissue oxygen saturation. Bland-Altman diagram is plotted with the difference [δ rSO2 (j)− δ Sa/vO2 (j)] as y-axis and [δ rSO2 (j)+ δ Sa/vO2 (j)]/2 as x-axis. The excluded data are explained. Average deviation Bs, the variance of population deviation, and variance of different individual deviation were calculated, and consistency limit Bs±1.96SD was analyzed. Finally, 10 people were selected for the final experiment. The experiment was conducted according to the following procedures (Figure 3) and was carried out using a lower oxygen platform (Figure 4).
EQUIPMENT AND PROCEDURES
Preparation
The subject was not sedated or anesthetized the night before the test. The blood gas analyzer was calibrated before use to ensure its measurement accuracy (SaO2 accuracy is not less than 1%) and used in accordance with the manufacturer’s recommendations and auxiliary materials. Preparation of consumable materials: single vena cava puncture catheter, arterial indwelling needle, arterial blood gas sampler, 2ml syringe, 5ml syringe, heparin salt solution, disposable pressure sensor. After testing the normal gas path to produce different partial pressure of oxygen gas mixing instrument, to achieve the mixed output of O2, N2, and CO2, the concentration of O2 in the output gas FiO2 can be read directly from the equipment. Non-invasive ECG monitoring devices and gas monitoring devices were used to monitor the physiological parameters of subjects. The standard monitor pulse oximeter sensor was placed on the right index finger of the subject. The forehead of the subject is cleaned with an alcohol cotton ball, and after ensuring that the forehead skin of the subject is clean, dry, and intact without any powder, oil, or lotion, the sensors of the test instrument are placed on the left and right forehead respectively. A respirator mask was put on and performed the oxygen-lowering process according to Figure 1. The oxygen-lowering process (according to figure 4) lasts for 1 minute on each platform and the EtCO2 is kept at ±5 mmHg of the baseline value. FiO2 on each SpO2 platform was recorded to make subjects feel adapted to the deoxygenation process, and each FiO2 value was used as the reference value for subsequent adjustment on each platform. The subjects were placed supine under local anesthesia with 2% lidocaine. The left or right radial artery was punctured with an indent needle, and two radical catheters (one in the right and one in the left radial artery) were sealed with a pressure sensor connected with a prefilled heparinized salt solution. Under local anesthesia with 2% lidocaine, the central venous catheter was retrogradely penetrated into the right internal jugular vein guided through ultrasound, and the catheter was placed to the bulb of the internal jugular vein. After the location of the catheter was determined, the pressure sensor of prefilled heparinized salt solution was connected. Medical instrument for the test: Brain tissue oxygen saturation monitor, model: MOC-100; Medical instrument for control: Blood gas analyzer, model: ABL90 FLEX.
Procedures
Platform 1: The pulse oximeter showed 98%±2%, which was the baseline value of the subjects (Figure 4). After two minutes, a 0.5-1ml venous blood sample was slowly extracted, keeping the extraction time more than 30s to reduce the return of nonjugular blood to the jugular bulb. While collecting the venous blood samples, 0.5-1ml of arterial blood samples were also taken. The cerebral oxygen saturation value (rSO2) was recorded at the beginning and end of venous blood sampling. After the first venous blood sample was taken, the platform was kept stable for 1 minute, and the sampling was repeated to obtain the second venous blood sample, the second arterial blood sample, and the cerebral oxygen saturation values of the two groups before and after the venous blood samples. Oxygen was lowered and the FiO2 value was adjusted so that the value of the standard monitor pulse oximeter was 95±2%. After two minutes, the blood sample was repeated to obtain two groups of venous blood samples and arterial blood samples, and the oxygen saturation values of the left and right cerebral brain of the four groups were obtained. The previous steps of sampling were repeated when the pulse oximetry values continue to drop in each platform. All these procedures were repeated to obtain data on blood and brain oximetry monitoring values for the platform 3-7 test. The subjects were provided with normal atmospheric air, and the baseline value was restored. After two minutes, the blood sampling process of the previous steps was repeated. Two groups of venous blood samples and arterial blood samples were obtained in total, and four groups of cerebral oxygen saturation values were obtained. FiO2 value was adjusted so that the pulse oximeter value of the standard monitor was displayed as 100%. After two minutes, the blood sampling process of the previous steps was repeated. Two groups of venous blood samples and arterial blood samples were obtained, and the oxygen saturation values of the left and right cerebral brain of the four groups were obtained. The subjects were allowed to breathe directly into the atmosphere, returned to baseline values, and 5 minutes later, the experiment ended. After the completion of the test, the jugular vein, arterial catheter, test instruments, standard monitor, pulse oxygen monitor, and physiological monitoring instruments were removed, and the subjects were observed for 2 hours. The medical staff ensured that the subjects were safe and allowed to leave. The subjects were followed up 2 days later by telephone to see if there was any abnormality, or the wound of catheterization was examined in the outpatient department, and antibiotics were added (according to figure 4 and figure 5).
STATISTICS
Statistical design, methods, and analysis procedures
In this clinical trial, absolute accuracy and trend accuracy were confirmed to be the main indexes to verify the effectiveness of the brain oxygen meter. Upon referring to the accurate definition of a pulse oximeter and the accurate definition of brain oximeter in relevant research [11], the absolute accuracy of brain oximeter (Arms) was defined as the root mean square difference between the cerebral oximeter monitoring value and the weighted value Sa/ vO2 of blood oxygen saturation measured by the Co-oximeter. The trend accuracy of oximeter was defined as the root mean square of the difference between the change of oximeter value and the change of Sa/vO2, a weighted value of blood oxygen saturation, measured by the corresponding Co-oximeter.
Statistical software: Processing and analysis of data sets were performed by Matlab2016.
Basic principles: All statistical inferences adopted a two-sided test, the test level with statistical significance was set at 0.05, and the confidence interval (CI) of parameters is estimated by 95% confidence interval level.
Missing data: Missing data were not estimated in this study.
Eliminating data: Unstable data sets were eliminated. From the beginning of a collection of jugular vein blood samples to the end of the collection, data with changes of blood oxygen saturation measured by quality control equipment (pulse oximeter) exceeding 3% [11] were eliminated. If the blood oxygen platform appeared unstable, all data of the subject were removed. They included unstable blood oxygen platforms, air leakage in the blood drawing process, and the data groups with blood gas separation time exceeding 1.5 hours. Data were excluded if it is confirmed by a review that the test conditions for some data are outside the test protocol.
Check outliers: The average of the difference value of the data group was calculated. If the difference value of the data group exceeded 4 times the average value, the data group was judged as an outlier.
Absolute Accuracy Verification
Absolute accuracy of calculation: The absolute accuracy of the brain tissue oxygen saturation monitor is defined as the root mean square value of the rSO2-SA /vO2 difference, and the calculation formula is:

Wherein, rSO2 is the of rSO2 left 1 and the of rSO2 right 1 displayed by the brain oxygen meter at the beginning of blood drawing, and the brain oxygen meter at the end of blood drawing. The mean values of rSO2 left 2 and rSO2 right 2; Sa/vO2 refers to SjvO2 obtained by blood gas analysis of venous blood and SaO2 obtained by blood gas analysis of arterial blood after blood sampling. The weighted average value was calculated according to the formula 0.7×SjvO2+0.3×SaO2; I represent the corresponding valid data group. Root mean square calculation was performed on the difference between the effective data sets of the subjects. The accuracy was obtained, if ≤10%, it was considered as the acceptable range.
Auxiliary Bland-Altman analysis: Taking the difference (rSO2(i)−Sa/vO2(i)) as Y-axis, and (rSO2(i)+Sa/vO2(i))/2 as X-axis, Bland-Altman plot was drawn and the excluded data were explained. The average deviation Bs, σ2 of total deviation and σ2μ of different individual deviation were calculated, and consistency limit Bs ±1.96SD was analyzed.
Correlation analysis: Linear regression, correlation coefficient calculation, and precision Sres were performed.
Trend Accuracy Verification
The trend accuracy of the brain tissue oxygen saturation monitor was defined as the root mean square value of rSO2- Sa/vO2 difference. The first effective data point rSO2(1) of the first platform range is taken as the baseline value and the change between the monitor display value and the baseline rSO2(j) when collecting the j+1 effective blood sample and is calculated according to Formula (2). Change Sa/vO2(j) between the weighted mean of blood gas analysis and baseline within the corresponding platform range was calculated according to Formula (3). Trend accuracy was calculated according to Formula (4). If root means square ≤5%, it was clinically acceptable.
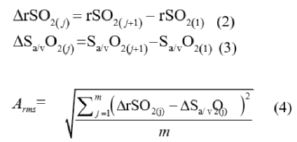
In the type: j = 1, 2, …, m; m=n−1
Auxiliary Bland-Altman analysis: Bland-Altman plot with difference [ΔrSO2(j)−ΔSa/vO2(j)] as y-axis and [ΔrSO2(j)+ΔSa/vO2(j)]/2 as x-axis. The mean deviation Bs, the σ 2 of the population deviation and the σ2ʊ of different individual deviation were calculated, and consistency limit Bs± 1.96SD was analyzed.
Correlation analysis: Linear regression, calculated correlation coefficient Sres, and calculated precision Sres were performed. The correlation between the adverse events that occurred in the test and the test device was analyzed, and the safety of the test device was described and evaluated.
RESULTS
Statistical Study Population And Data Set
Demographic indicators of the subjects include age, sex, race, and weight. A total of 10 patients were enrolled in and out of the group, including 7 males and 3 females. Age range: 19-30 years old, average age: 24±7.84 years old (mean 1.96SD), weight range: 50-85kg, average body weight: 63.6 ± 22.5kg (mean 1.96SD). The details are shown in Table 1.
Absolute Accuracy Evaluation
Further, a linear regression analysis was performed on the noninvasive monitoring value of the test instrument and the blood gas analysis value (as shown in Figure 6). The fitting linear equation was rSO2=4.89+0.93×Sa/vO2, with a slope of 0.93, close to 1, and the regression line was close to the 45° diagonal trend. The correlation coefficient between rSO2 and Sa/vO2 was 0.95, indicating that there was a good correlation between the non-invasive monitoring value and the invasive blood gas analysis value.
To sum up, the statistical analysis results of the test instrument monitoring values and blood gas analyzer testing values are summarized in Table 2. The mean deviation (Bs), standard deviation (SD), correlation coefficient (R), root mean square difference (Arms) and blood gas analysis were 0.42%, 3.23%, 0.95, and 3.25%, respectively, which met the clinical evaluation standard of Arms ≤10%.
Trend Accuracy Evaluation
The Bland-Altman analysis chart of non-invasive monitoring value of test equipment and the invasive detection value of blood gas analysis equipment is shown in Figure 7, indicating that the average difference of trend change of the test equipment monitoring value and the detection value of blood gas analysis is very small (Bs=Means ( rSO2 - Sa/vO2) = -0.32%). The results showed that, in statistical significance, the trend changes of the test equipment monitoring value and blood gas detection value were basically consistent. Moreover, the 95% consistency interval of the trend change difference between the two was narrow ([Bs-1.96SD, Bs+1.96SD] = [-6.13%, 5.5%]), indicating that the trend change difference variation of the two equipment was small. The above analysis shows that there is a good consistency between the noninvasive monitoring value of the test equipment and the invasive test results of the blood gas analysis equipment.
Linear regression analysis was made on the changes in the monitored values of the test instruments and the measured values of blood gas analysis. The analysis results are shown in Figure 8. The fitted linear equation was rSO2=-0.98+0.93 Sa/vO2, and the slope was 0.93, which was close to 1. The correlation coefficient of trend changes of the two equipment is 0.95, indicating that the changing trend of the test equipment and blood gas analyzer has a good correlation. On analysis of the trend changes value, due to the variation of every subject being relative to the first platform, the first blood gas analysis values were considered as the base value in the calculation. Hence, the data points less than 10 absolute value analysis, and the statistical analysis of the results are summarized in Table 3. In the trend changes of test equipment monitoring and blood gas analysis, the average deviation was 0.32%, and the standard deviation was 2.97%. Also, the trend root mean square Arms was 2.97%, which met the clinical evaluation standard of trend Arms ≤5% (Figure 9).
DISCUSSION
The brain is the central nervous organ of the human body, and its weight is only about 2% of the whole-body weight. However, the blood flow and oxygen consumption of brain tissue are very huge, and estimations show that in the resting state its blood flow is about 15% of the heart output and the oxygen consumption is about 20% of the total oxygen consumption of the human body [4]. Moreover, brain tissue itself has almost no energy supply material reserves and needs to rely on blood circulation to absorb oxygen to maintain normal physiological functions. Therefore, the human brain is highly sensitive to ischemia and hypoxia, and a short period of ischemia and hypoxia may lead to irreversible brain tissue damage [5]. However, standard monitoring methods of systemic arterial and venous oxygen saturation may not represent the oxygenation state in peripheral tissues such as the brain [6,7]. Therefore, maintenance of adequate cerebral oxygenation may increase patient safety by preventing decreased cerebral perfusion and prolonged cerebral tissue ischemia. According to relevant medical statistics, the limit of tolerance of brain tissue to ischemia and hypoxia is 4-6min, and more than 90% of people dying from brain injury suffer from brain tissue ischemia and hypoxia [6]. Under normal conditions, oxygen supply and oxygen consumption keep a dynamic balance. However, for critically ill patients with special cerebral resuscitation, pathologically dependent oxygen consumption may occur. An increase or decrease of oxygen consumption varies with fluctuation in oxygen supply, reflecting the existence of hypoxia and oxygen debt, which may lead to cerebral ischemia, hypoxia, and brain tissue damage [7]. The brain is an organ with poor tolerance to hypoxia, but many central nervous system diseases and complications are caused by abnormal brain oxygen metabolism. Therefore, it is very important to monitor cerebral oxygenation from the perspective of maintaining the balance between cerebral oxygen supply and demand to guide brain protection and brain resuscitation.
The oxygen saturation monitor of brain tissue can monitor oxygen supply and oxygen consumption in time and provide a reference index for clinical intervention. The brain oxygen saturation monitors measures SarterioleO2, microvenous blood in the brain (SvenuleO2), and capillaries (ScapillaryO2) blood oxygen saturation weighted average, namely: rSO2 = α×SarterioleO2 + β×SvenuleO2 + γ×ScapillaryO2 (equation: α + β + γ = 1). Due to the small proportion of capillaries, oxygen saturation in capillaries can be ignored, γ is 0. In the early stage, α and β were established by algorithm verification. For example, Invos3100A, the first commercially available brain oxygen meter product in the world, determined α=0.25 and β=0.75 according to the algorithm, and the ratio was verified by clinical trials [8]. Later, positron emission computed tomography (PET) imaging of the head by Ito et al. showed that the arteriovenous ratio was closer to 30:70 [9,10]. Subsequently marketed brain oxygen meter products (FORE-SIGHT, NIRO-200NX, EQUANOX, O3) were designed and clinically validated according to this ratio. This clinical trial protocol was formulated by referring to technical Guidelines for Clinical Evaluation of Pulse Oximeter Equipment issued by the China Food and Drug Administration in 2016, special Requirements for the Basic Safety and Main Performance of YY 0784-2010 Medical Pulse Oximeter Equipment for Medical Electrical Equipment, and the clinical trials of domestic and foreign commercially available products. The test instrument, MOC-100, sends different wavelengths of near-infrared light through the scalp and skull to the brain via disposable sensors on the patient’s forehead. The reflected light is captured by a detector located on the sensor for optimal signal acquisition. After analyzing the reflected light, the absolute value of brain tissue oxygen saturation is displayed on the screen and a graphical representation of the historical values is provided.
Every clinical innovation monitoring product is required to evaluate its effectiveness and reliability. The basic principle of the brain oxygen saturation monitor is similar to the pulse oximeter, but it directly measures the oxygen saturation of the brain tissue without the need for arterial pulsation degrees. According to the Technical Guidelines for Clinical Evaluation of Pulse Oximeter Equipment issued by The State Food and Drug Administration in 2016 and YY 0784-2010, a pulse oximeter is used for the induced hypoxia test of healthy adults, and the hypoxia platform covers the range of 70-100% pulse oxygen saturation. The co-oximeter was used to analyze the oxygen saturation of the arterial blood sample as the control or another pulse oximeter was used as the secondary comparison standard, but the measured value of the control pulse oximeter could be traced back to the co-oximeter. The test values of the experimental group were compared with those of blood gas analysis to calculate the accuracy of the test instrument. There is a strong clinical need for accurate tracking of rSO2 in peripheral tissues, particularly brain tissue during the perioperative phase to avoid ischemia [11]. A recent study compared the performance of 5 different commercially available regional oximeters in normal volunteers during hypoxemia. This evaluation demonstrated that currently available regional oximeters often perform with limited absolute accuracy, manifesting in an average ARMS of 9.1% for all 5 devices with a range of 4.28% to 9.68%.[10] We believe these findings demonstrate that enhancements to regional oximetry are desirable and would improve clinical confidence and clinical management with regional oximetry [12].
In this paper, we report the results of a clinical study evaluating the absolute and trending accuracy of a new brain pulse oximeter (MOC-100) for continuous, non-invasive measurements of rSO2. The Bland-Altman analysis diagram of non-invasive blood oxygen saturation monitoring value and invasive blood gas detection value of the test device obtained in clinical trials is drawn by analyzing the data, as shown in Figure 6. It is evident that the average difference between the test instrument monitoring value and the blood gas detection value is very small (Bs = Means (rSO2- SA/VO2) = 0.42%), indicating that the test instrument monitoring value and the blood gas detection value are basically consistent in statistical significance. The 95% consistency interval of the difference between the two is narrow ([BS-L.96SD, Bs+ L.96SD] = [-5.9%, 6.75%]), indicating that the variation of the measurement between the two equipment is small. The above analysis shows that the non-invasive tissue oxygen saturation monitoring of the test equipment is between the invasive test results of the blood gas analysis equipment. These statistics indicate that MOC-100 has an absolute mean deviation (Bs), standard deviation (SD), correlation coefficient (R), root mean square difference (Arms), and blood gas analysis which was 0.42%, 3.23%, 0.95, and 3.25%, respectively, and satisfying the clinical evaluation standard of Arms 30%.
We believe that an accurate measurement strategy is very important for successfully developing a regional oximeter with good absolute measurement accuracy and strike accuracy. In order to be able to accurately calibrate the device, it is important to achieve a stable plateau long enough to achieve stable arterial saturation even in the face of changes in respiratory rate. In addition, care should be taken to avoid injury to the ipsilateral artery during retrograde placement of the jugular catheter and extraction of blood [13]. Reference cerebral tissue oxygen saturation is commonly assumed as a weighted sum of the arterial (A) and venous (V) oxygen saturation, which is kept constant (e.g., our analysis used the A/V ratio of 70/30). However, the A/V ratio is not necessarily constant because both the cerebral blood volume as well as oxy- and de-oxy hemoglobin concentrations change in response to other hemodynamic variations. For example, Bickler et al. [14] reported that patients had different ratios of venous and arterial blood in the sensor field. Such conditions and other factors altering arterial and venous ratio indicate that the reference oxygen saturation has an estimation error, which affects both calibrations of the device as well as validation accuracy. Limitations of our study include the population of relatively young, healthy, adult volunteers, which may not reflect the performance in critically ill perioperative patients [16-22].
Up to now, there are no relevant standards and guidelines for technical review of registration of cerebral oxygen meter. In 1996, INVOS 3100A was first approved by the FDA for marketing in the United States to monitor trends in cerebral oxygen saturation [4,5,23-26] rather than to measure the exact value of cerebral oxygen saturation, mainly because there was no established clinical method to verify the accurate measurement of cerebral oxygen saturation. After more than a decade of clinical application and the marketing of several cerebral oxygen meter products, a unified clinical validation method has gradually been formed which can be accepted by clinical and regulatory departments. A review of 510K data for certified brain tissue oxygen saturation monitors on the FDA website [5,7-16] shows that the efficacy and safety of brain oxygen monitors can be confirmed by induction deoxygenation tests in healthy individuals, such as INVOS 3100A by Somanetics (acquired by Medtronic) [7,17-22] FORE SIGHT Model 2040[8, 9] MC2000[10]. In addition to the data disclosed by FDA, the research results published by other relevant research institutions in the world [4,10-16] also show that induction deoxygenation test is a safe and effective feasible method to evaluate brain oxygenation apparatus in healthy subjects.
CONCLUSION
In this study, we calculated the difference between rSO2 measured by brain oxygen saturation monitor and Sa/vO2 measured by invasive blood gas analysis. Data were analyzed by the consistency of brain oxygen saturation analyzer and blood gas analyzer and calculated the accuracy of brain oxygen saturation monitoring. Accurate data acquisition is required to study the precision of the MOC-100 pulse oximeter. Among the methods used in this study, MOC-100 regional oximetry provided mean deviation (Bs) of 0.42%, standard deviation (SD) of 3.23%, correlation coefficient (R) of 0.95, root mean square difference (Arms) of 3.25% compared with blood gas analysis. Healthy volunteers who met the Arms 30% clinical evaluation criteria and received controlled oxygenation experiments. There was a good correlation and consistency between the test instrument monitoring value model: MOC-100 and the absolute value of the blood gas analyzer. A brain tissue oxygen saturation monitor is used for continuous noninvasive monitoring of local tissue oxygen saturation.
DECLARATIONS
Ethics Approval And Consent To Participate
This study was approved by the Medical Ethics Committee, Zhongnan Hospital of Wuhan University, Wuhan, Hubei, P.R. China (2019007). All experimental methods are followed in accordance with the relevant guidelines and regulations. The study has been retrospectively registered in Chinese Clinical Trial Registration with the registration number ChiCTR2100052321, with the date of registration 24/10/2021.
FUNDING
This work was supported by the Wuhan Application Foundation Frontier Project: 2020020601012227 and National Natural Science Foundation of China No. 81771160.
TRIAL REGISTRATION
The study has been retrospectively registered in Chinese Clinical Trial Registration with the registration number ChiCTR2100052321, dated 24/10/2021.
REFERENCES
- McKnight JC, Ruesch A, Bennett K, Bronkhorst M, Balfour S, et al. (2021) Shining new light on sensory brain activation and physiological measurement in seals using wearable optical technology. Philos Trans R Soc Lond B Biol Sci 376(1830): 20200224.
- Vegi Y, Charnley M, Earl SK, Onofrillo C, Del Rosal B, et al. (2021) Photothermal release and recovery of mesenchymal stem cells from substrates functionalized with gold nanorods. Acta Biomater 129: 110- 121.
- Matcher SJ, Elwell CE, Cooper CE, Cope M, Delpy DT (1995) Performance comparison of several published tissue near-infrared spectroscopy algorithms. Anal Biochem 227(1): 54-68.
- Pereira-Figueiredo D, Nascimento AA, Cunha-Rodrigues MC, Brito R, Calaza KC (2021) Caffeine and Its neuroprotective role in ischemic events: A mechanism dependent on adenosine receptors. Cell Mol Neurobiol.
- US Food and Drug Administration (FDA) 510(k) Database.
- Forcione M, Ganau M, Prisco L, Chiarelli A, Bellelli A, et al. (2021) Mismatch between tissue partial oxygen pressure and near-infrared spectroscopy neuromonitoring of tissue respiration in acute brain trauma: The rationale for implementing a multimodal monitoring strategy. Int J Mol Sci 22(3): 1122.
- Kooman JP, Stenvinkel P, Shiels PG, Feelisch M, Canaud B, et al. (2021) The oxygen cascade in patients treated with hemodialysis and native high-altitude dwellers: lessons from extreme physiology to benefit patients with end-stage renal disease. Am J Physiol Renal Physiol 320(3): F249-F261.
- US Food and Drug Administration (FDA) 510(k) Database.
- US Food and Drug Administration (FDA) 510(k) Database.
- US Food and Drug Administration (FDA) 510(k) Database.
- Kadokura Y, Hayashida M, Kakemizu-Watanabe M, Yamamoto M, Endo D, et al. (2021) Cerebral oxygen saturation (rSO2) during cardiopulmonary bypass (CPB) measured using the INVOS oximeter closely correlates with baseline rSO2. J Artif Organs 24(4): 433-441.
- Lee JH, Song IS, Kang P, Hwan Ji S, Eun Jang Y, et al. (2022) Validation of the Masimo O3™ regional oximetry device in pediatric patients undergoing cardiac surgery. J Clin Monit Comput.
- Ferral H, Alonzo MJ (2016) Transjugular venous approach for endovascular intervention in upper-extremity dialysis access fistulae and grafts. Semin Vasc Surg 29(4): 206-211.
- Bickler PE, Feiner JR, Rollins MD (2013) Factors affecting the performance of 5 cerebral oximeters during hypoxia in healthy volun- teers. Anesth Analg 117: 813-823.
- US Food and Drug Administration (FDA) 510(k) Database.
- Benni PB, MacLeod D, Ikeda K, Lin HM (2018) A validation method for near-infrared spectroscopy based tissue oximeters for cerebral and somatic tissue oxygen saturation measurements. J Clin Monit Comput. 32(2): 269-284.
- Redford D, Paidy S, Kashif F (2014) Absolute and trend accuracy of a new regional oximeter in healthy volunteers during controlled hypoxia. Anesth Analg 119(6): 1315-1319.
- MacLeod DB, Ikeda K, Vacchiano C, Lobbestael A, Wahr JA, et al. (2012) Development and validation of a cerebral oximeter capable of absolute accuracy. J Cardiothorac Vasc Anesth 26(6): 1007-1014.
- Ikeda K, MacLeod DB, Grocott HP, Moretti EW, Ames W, et al. (2014) The accuracy of a near-infrared spectroscopy cerebral oximetry device and its potential value for estimating jugular venous oxygen saturation. Anesth Analg 119(6): 1381-1392.
- Okonkwo DO, Shutter LA, Moore C, Temkin NR, Puccio AM, et al. (2017) Brain oxygen optimization in severe traumatic brain injury phase-II: A phase II randomized trial. Crit Care Med 45(11): 1907-1914.
- Villar J, Ferrando C, Martínez D, Ambrós A, Muñoz T, et al. (2020) Dexamethasone treatment for the acute respiratory distress syndrome: a multicentre, randomised controlled trial. Lancet Respir Med 8(3): 267- 276.
- National Medical Products Administration. Administrative measures for registration of medical devices.
- State Medical Products Administration. Standard for quality management of clinical trials on medical devices.
- World Medical Congress. Declaration of Helsinki.
- National Medical Products Administration. YY 0784-2010 Medical electrical equipment-Special requirements for basic safety and main performance of medical pulse oximeter equipment.
- National Medical Products Administration. Technical Guidelines for Clinical Evaluation of Pulse Oximeter Equipment.
Article Type
Research Article
Publication history
Received Date: April 29, 2022
Published: May 11, 2022
Address for correspondence
Zongze Zhang, Department of Anesthesiology, Zhongnan Hospital of Wuhan University, Wuhan, Hubei 430071, P.R. China
Copyright
©2022 Open Access Journal of Biomedical Science, All rights reserved. No part of this content may be reproduced or transmitted in any form or by any means as per the standard guidelines of fair use. Open Access Journal of Biomedical Science is licensed under a Creative Commons Attribution 4.0 International License
How to cite this article
Kai Chen, Meng-Yun L, Lijuan T, Yufeng Z, Zongze Z. Clinical Evaluation and Validation of A New Brain Oxygen Saturation Monitoring Instrument. 2022- 4(3) OAJBS. ID.000448.
Figure 1: Extinction coefficient of HHb, HbO2 and water between 650~1000nm.
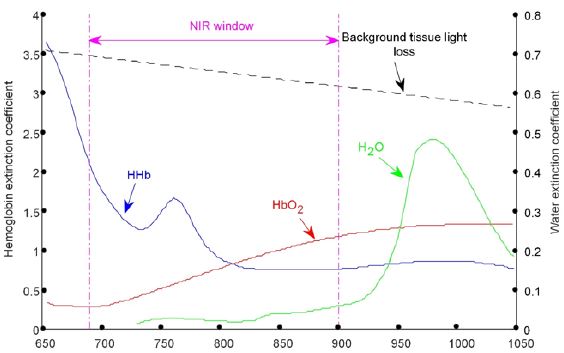
Figure 2: Schematic diagram of light emission and reception of brain oximeter.
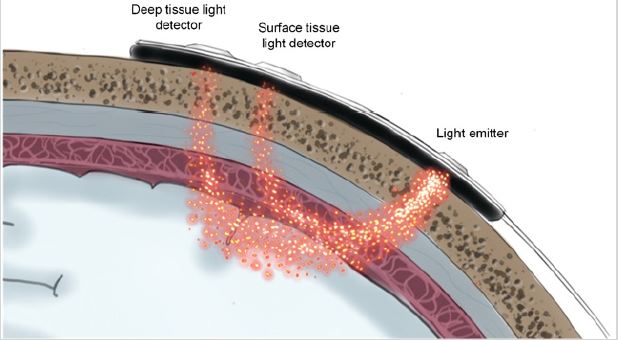
Figure 3: Trial process.
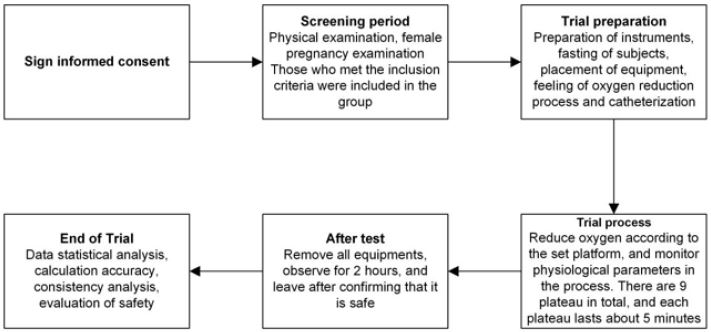
Figure 4: Stepped Hypoxia Plateau Sequence Protocol with targeted pulse oximetry SpO2 values.
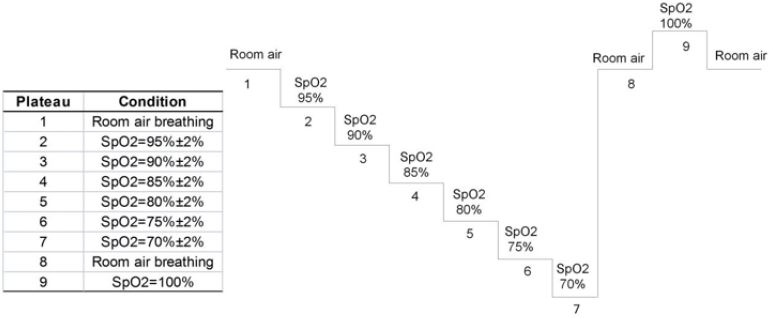
Figure 5: Schematic diagram of induced oxygen reduction trial.
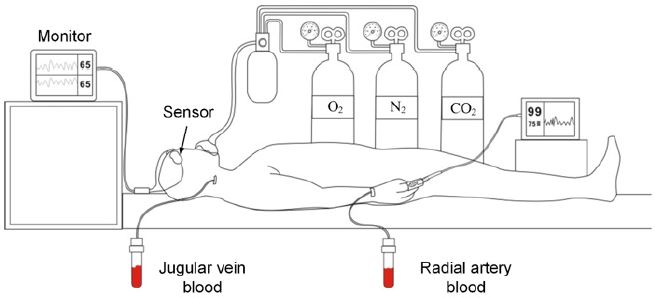
Figure 6: Bland-Altman analysis of the absolute value between the subject device and blood gas analyzer.
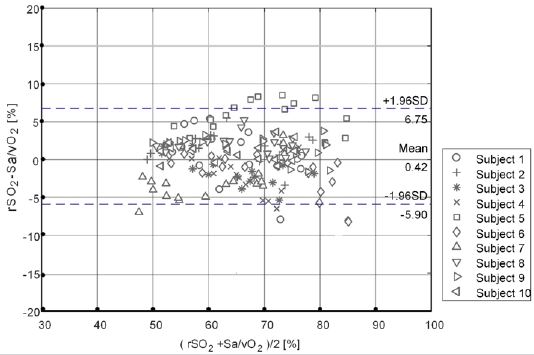
Figure 7: Correlation analysis of the absolute value between the subject device and blood gas analyzer.
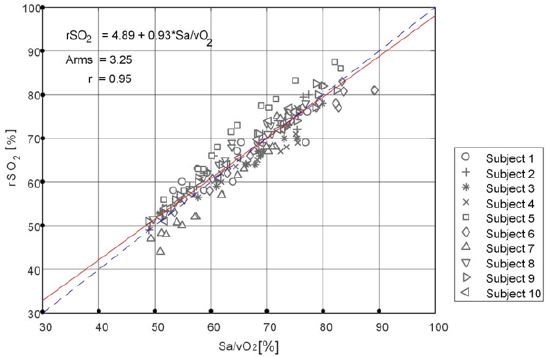
Figure 8: Bland-Altman analysis of the trend value between the subject device and blood gas analyzer.
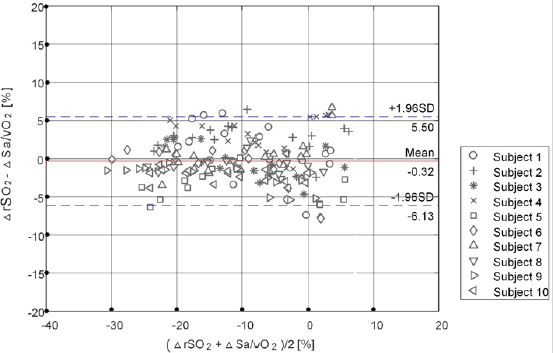
Figure 9: Correlation analysis of the trend value between the subject device and blood gas analyzer.
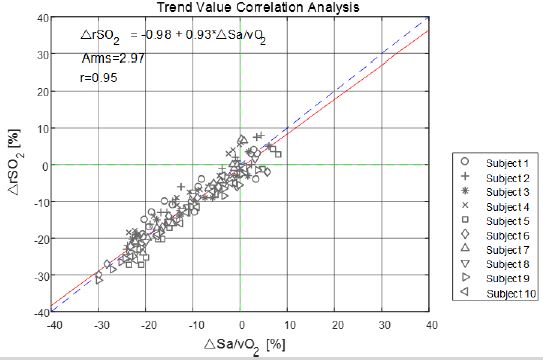
Table 1: Summary table of subject’s demographics.
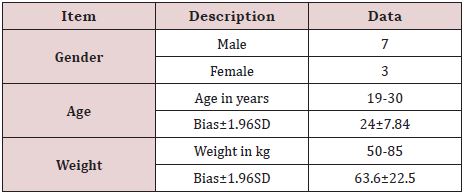
Table 2: Statistical results of the absolute value between the subject device and blood gas analyzer.

Table 3: Statistical results of the trend value between the subject device and blood gas analyzer.

