
Clinical and CT Features of Critically Ill Patients Requiring Ventilation Who Recovered from COVID-19 Pneumonia
ABSTRACT
Objectives: To investigate the clinical and CT features of critically ill patients requiring ventilation who early recovered from
COVID-19 pneumonia.
Methods: The clinical, laboratory and CT features of COVID-19 patients at Tongji Hospital in Wuhan from Jan 31, 2020, to April
20, 2020, were retrospectively analyzed. Patients who required ventilation during treatment were defined as group 1. Meanwhile,
patients who received conventional oxygen inhalation therapy in the same wards were defined as group 2. The clinical characteristics
and follow-up CT images were collected and compared between the two groups.
Results: A total of 160 discharged patients were included, of whom 43 were in group 1 and 117 were in group 2. The average
age of patients in group 1 (61.9 ± 14.6 d) was significantly higher than that in group 2 (p=0.004), and the proportion of patients
with complications in group 1 was markedly higher than that in group 2 (38 [88.4%] vs 54[46.2%]). Compared to patients in
group 2, patients in group 1 more frequently had lymphopenia, with higher levels of high-sensitivity C-reactive protein, ferritin. In
group 1, 27 patients (62.8%) showed ground-glass opacities (GGOs), and 42 (97.7%) showed signs of fibrosis. Patients in group 1
experienced longer hospital stays than those in group 2 (52.5 ± 12.8 d vs 17.7 ± 10.3 d, p<0.001).
Conclusion: Critically ill patients who required ventilation assistance for COVID-19 were older, worse laboratory test results. A
great majority of patients showed pulmonary fibrosis on chest CT when they were discharged.
KEYWORDS
COVID-19; Critical illness; Ventilators; Pulmonary fibrosis; Patients at discharge
ABBREVIATIONS:
COVID-19: Coronavirus Disease 2019; SARS-CoV-2: Severe Acute Respiratory Syndrome Coronavirus 2; MERS: Middle East Respiratory Syndrome; ICU: Intensive Care Unit; ARDS: Acute Respiratory Distress Syndrome; IQR: Interquartile Range
INTRODUCTION
Coronavirus disease 2019 (COVID-19), the illness caused by severe acute respiratory syndrome coronavirus 2 (SARS-CoV-2), was first identified in Wuhan, China in December 2019 and has since rapidly spread to more than 200 countries and become a worldwide pandemic [1,2]. Coronaviruses belong the order Nidovirales and to the family Coronaviridae, a family that includes viruses that cause diseases ranging from the common cold to severe acute respiratory syndrome (SARS) and Middle East respiratory syndrome (MERS) [3]. In the past twenty years, two coronavirus epidemics have occurred. SARS-CoV provoked a large-scale epidemic beginning in China and involving two dozen countries with approximately 8,000 cases and 800 deaths, and the MERS-CoV began in Saudi Arabia, had approximately 2,500 cases and 800 deaths and still causes sporadic cases [4]. More and more patients have infected and died from COVID-19, overloading and even overwhelming the global medical health system.
The treatment of COVID-19 is multistep and requires multidisciplinary cooperation, and oxygen therapy represents the major treatment intervention for patients with severe infection [4]. Nasal catheter oxygen inhalation, mask oxygen inhalation, high-flow oxygen inhalation, noninvasive ventilation and invasive ventilation are common methods of oxygen therapy during the disease course. Mechanical ventilation may be necessary in cases of respiratory failure refractory to ordinary oxygen inhalation therapy. It described patients with critical COVID-19 who were admitted to an ICU in Wuhan, China. The mortality rate among those who required noninvasive ventilation was 23 (79%) of 29, and among those who required invasive mechanical ventilation, it was 19 (86%) of 22 [5]. Even with various treatments, it remains difficult for critically ill patients to survive. Treatment of critically ill patients with COVID-19 pneumonia remains challenging [6,7]. Therefore, by analyzing the clinical characteristics of patients who recovered quickly from critical pneumonia, especially those who required ventilator assistance for breathing, we can better understand the characteristics and course of the disease.
In this study, patients who were discharged from a single center who had been critically ill with pneumonia after using ventilators were recruited. Their main clinical characteristics, laboratory tests and the CT features of discharged patients in the same wards cured by conventional oxygen inhalation were also collected. We analyzed the follow-up chest CT features to make a more comprehensive analysis of the disease and prognosis of discharged patients.
MATERIALS AND METHODS
Patients
This study received medical ethical committee approval from the Ethics Committee of Tongji Hospital, Tongji Medical College, Huazhong University of Science and Technology, and the requirement for patient informed consent was waived under the Council for International Organizations of Medical Sciences guidelines. A single-center case series of 160 consecutive patients with laboratory-confirmed COVID-19 at Tongji Hospital in Wuhan from January 31, 2020, to April 20, 2020, were retrospectively included. All enrolled patients were diagnosed under the guidelines released by the National Health Commission of China [8]. All patients also met specified de-isolation and discharge criteria as follows [8,9]: (1) the body temperature returned to normal for more than three days; (2) respiratory symptoms improved significantly; (3) chest CT imaging showed significant improvement with the reabsorption of acute exudative lesions; and (4) the nucleic acid tests of samples from the respiratory tract were negative on two consecutive tests (with a sampling time interval of at least 24 hours). Patients who met the discharge criteria were discharged to a rehabilitation hospital designated for step-down care or to hotel isolation.
Patients requiring invasive ventilation or noninvasive ventilation during treatment were defined as group 1. Treatment of patients was consistent with current standards for tracheal intubation and respiratory treatment. Endotracheal intubation was performed for patients showing no improvement in respiratory distress, tachypnea (respiratory rate greater than 30 breaths per minute), and poor oxygenation (PaO2 to FiO2 ratio less than 150 mmHg) after 2 hours of high-flow oxygen therapy or noninvasive ventilation [10]. Moreover, 117 patients who used conventional oxygen inhalation during treatment in the same wards were defined as group 2. Clinical laboratory data included complete blood counts, serum biochemical tests (including liver and renal parameters and myocardial marker, lactate dehydrogenase, coagulation profiles). The data collection forms were reviewed independently by two researchers.
Review of CT Images
According to the recommendations of the National Health Commission, patients should undergo follow-up CT scans before discharge. Chest CT images were obtained using one of three CT systems (LightSpeed Plus-GE, Aquilion ONE, and UCT 780) with patients in the supine position. All CT images were reviewed by two radiologists (S.C.Z. and G.T.K, with 11 and 8 years of clinical experience, respectively) using the picture archiving and communication system (PACS). CT images were reviewed to optimally assess the lung parenchyma (window level, -500 to -700 Hounsfield units [HU]; window width, 1,000-1,500 HU) and mediastinum (window level, 20–50 HU; window width, 350-450 HU).
All terms were defined according to the Fleischner Society guidelines [11]. The CT images were evaluated for the following. (1) The presence of ground-glass opacities (GGOs) and the location of the lesion (peripheral, bilateral, multifocal or unifocal involvement). (2) Pulmonary fibrosis as indicated by the presence of a subpleural line, parenchymal bands, irregular interfaces, traction bronchiectasis, or reticulation [12,13]. A thickened interstitium could not be used as evidence of fibrosis, as it could also be present during acute lung disease [13]. Lobes with fibrosis were recorded. (3) The presence of other manifestations, such as consolidation, lymph node enlargement, pericardial effusion, and pleural effusion. Total lesion involvement (including GGOs and pulmonary fibrosis signs) in one or more of 18 segments in the lungs was collected. Decisions were made by consensus among the radiologists.
Statistical Analysis
All statistical analyses were performed with SPSS version 23.0 (Chicago SPSS Inc). Continuous data with normal and nonnormal distributions are expressed as the mean (± SD) and median (interquartile range [IQR]) values, respectively. Normally distributed data were analyzed by Student’s t-test; otherwise, the Mann-Whitney U test was used. A two-tailed p < 0.05 was considered statistically significant.
RESULTS
Demographics and Characteristics of Patients with COVID-19
The demographic characteristics are shown in Table 1. Among the 160 included patients, 43 patients (27 men, 16 women) were in group 1 (ventilator-assisted), and 117 patients (42 men, 75 women) were in group 2 (ordinary oxygen therapy). The average age of group 1 was significantly higher than that of group 2 (61.9 ± 14.6 years vs 54.5 ± 11.8 years, p=0.004), and 71.9% of the patients were older than 50 years old. The proportion of patients with complications in group 1 was significantly higher than that in group 2 (38 [88.4%] vs 54 [46.2%], p<0.001), and the incidence of dyspnea in group 1 was higher than that in group 2 (32 [74.4%] vs 52[44.4%], p=0.001). Regarding clinical signs, the average blood pressure of group 1 at admission was significantly higher than that of patients in group 2 (p=0.012); the average respiratory rate of patients was markedly increased (p=0.016), but the average heart rate was comparable between the two groups (p=0.477). All patients were discharged after a mean hospitalization period of 27.0 d (range: 9.0-74.0 days). Group 1 patients experienced longer hospital stays than group 2 patients (52.5 ± 12.8 d vs 17.7 ± 10.3 d, p<0.001). Systemic corticosteroid usage rates differed significantly between the two groups (p<0.001), while there was no significant difference in the average corticosteroid dosage between the two groups (p=0.155)
Laboratory Findings of Patients with COVID-19
Compared with normal ranges, the whole blood count of 22 (18.8%) patients in group 2 showed mild leucopenia, while almost all patients in group 1 had white blood cell (WBC) counts that were normal or above the upper limit of normal. Lymphocyte counts were significantly lower in group 1 patients (0.62 × 10⁹/L) than in group 2 patients (1.34 × 10⁹/L). Lymphopenia (lymphocyte count <0.8 × 10⁹/L) developed in 28 (65.1%) patients in group 1 and 25 (21.4%) patients in group 2 (p<0.001). Overall, group 1 patients had increased WBC counts (p <0.001) but lower lymphocyte counts (p <0.001). Compared with patients in group 2, inflammationrelated marker levels (high-sensitivity C-reactive protein and ferritin) were markedly higher in group 1 patients, meanwhile the levels of aspartate aminotransferase (AST), lactate dehydrogenase (LDH), blood urea nitrogen, high-sensitivity troponin, NT-proBtype natriuretic peptide (NT-pro BNP), D-dimer, and procalcitonin as well as prothrombin time were significantly higher in group 1 patients (Table 2).
CT Findings of Patients with COVID-19
The time interval between the illness onset and last CT scan before discharge was 40.8 ± 15.0 d in all patients (range: 9.0-89.0 days), and the mean time was longer in group 1 patients than in group 2 (56.7 ± 12.9 d vs 34.9 ± 10.9 d, p<0.001). In general, the CT signs of discharged patients can be normal, ground grass opacities (GGOs) or pulmonary fibrosis. The CT lesions of group 2 patients were resolved more quickly than those of group 1 patients. Among the 117 discharged patients in group 2, 37 patients (31.6%) had completely normal lung CT findings, 61 (52.1%) showed GGOs, and 37 (31.6%) showed signs of pulmonary fibrosis (Figure 1). Whereas in Group 1, no patients had completely normal lung CT findings, 27 (62.8%) showed GGOs, and 42 (97.7%) showed signs of fibrosis (Figure 2). The representative CT images of GGOs in both groups were peripheral, bilateral, and multilobe distributions, and some appearances of GGOs in group 1 were diffuse (Figure 2). We also observed a decrease in GGOs in the lungs accompanied by obvious signs of fibrosis in group 1 (Figure 2); moreover, fibrosis changes in groups 1 patients were more extensive than those in group 2 (lung lobes involved 3.2 ± 1.5 vs 0.6 ± 1.1, p<0.001). In group 1, pulmonary fibrosis mainly manifested as subpleural lines (36 [89.3%]), parenchymal bands (38 [88.4%]), traction bronchiectasis (21 [48.8%]) (Figure 2), and reticulation (11 [25.6%]). Regarding the distribution of lesions, the main manifestations were seen with symmetrical distribution in the double lower lungs (35 [81.4%]). The less common pulmonary fibrosis in group 2 mainly manifested as parenchymal bands (37 [31.5%]) (Figure 1) and subpleural lines (16 [13.7%]) (Figure 1). Other manifestations, such as interlobular septal thickening and mediastinal lymphadenopathy, were also obvious (30 [69.8%] vs 37 [31.6%]; 20 [46.5%] vs 32 [27.4%] in group 1 and group 2, respectively). Some patients showed lung consolidation (12 [27.9%]), and 3 patients had pericardial effusion and 5 had pleural effusion in group 1. The total abnormal lung segments involved in patients (including GGOs and pulmonary fibrosis signs) were significantly different between the two groups (8.4 ± 4.0 in group 1 vs 2.7 ± 2.4 in group 2, p<0.001). The main chest CT imaging features are shown in Table 3.
DISCUSSION
At present, the situation related to COVID-19 remains grim, and with limited treatment methods, oxygen therapy is an important therapeutic option [14]. The common conspicuous symptoms of exacerbated COVID-19 are acute hypoxemic respiratory insufficiency or the requirement for oxygen and ventilation treatment [5,6]. Critically ill patients can receive noninvasive or invasive mechanical ventilation. The timing of conversion to ventilator usage still lacks relevant clinical evidence in COVID-19 patients [7], and methods to better utilize ventilators are also being explored. Some scholars suggested that the usage of noninvasive ventilators would increase the risk of infection of the medical staff in the absence of protective materials and that noninvasive ventilators could not shorten the course of ARDS caused by pneumonia, but controversy surrounding this topic remains [7]. Some studies have shown that strategies should be formulated based on the phenotypes of patients for different pathophysiological mechanisms [15]. In clinical work, we found that early intubation could better relieve hypoxemia in patients but resulted in the risk of ventilator-associated pneumonia and even multidrug resistant bacterial infection. However, if the intubation was delayed, the patient’s condition deteriorated rapidly or even died in a short term. In this article, approximately 60% of patients in group 1 underwent endotracheal intubation, received a more aggressive respiratory therapy strategy, and achieved treatment success. Active endotracheal intubation and mechanical ventilation are alternative respiratory therapies in critically ill patients. However, more accurate and reasonable intubation time strategies need further study.
Similar to related studies, we found that most common symptoms of COVID-19 were fever, cough, dyspnea and diarrhea and that mainly older patients were affected, especially those suffering from diabetes, hypertension or chronic respiratory diseases [6,16]. In terms of laboratory findings, leukocytosis (≥10×109/L) but lymphocytopenia (<0.8×10⁹/L) were more frequently in the ventilated group than in the ordinary oxygen inhalation group. Lymphocytopenia was a hallmark finding in patients with severe COVID-19 and was present in 83.2% of the patients on admission [17]. The levels of AST, LDH, blood urea nitrogen, high-sensitivity troponin, NT-pro BNP, D-dimer and procalcitonin as well as prothrombin time were markedly higher in the ventilated group, suggesting more serious systemic organ damage. In a COVID-19 patient with lymphopenia, worsening coagulopathy, hepatitis, and rising ferritin, it may make sense to target immune hyperactivity before end-organ manifestations such as ARDS ensue [18] In this study, ARDS was the most common indication for transferring patients to ICU and glucocorticoids were applied only to patients with progressive deterioration of the oxygenation index, rapid progression by imaging, and overactivation of the inflammatory response in the body. Methylprednisolone was mainly used for short-term relief of patients’ symptoms, with a higher proportion of critically ill patients who received glucocorticoid therapy requiring ventilation, while the average dose between the two groups did not reach statistical significance.
The correlation between CT findings and disease severity and mortality can be concluded from several studies [19,20]. In severely ill patients, the representative CT findings were bilateral and multilobar involvement and subsegmental consolidative opacities [21]. In this study, the patients were discharged to a rehabilitation hospital designated for step-down care or to hotel isolation. We found that although the clinical symptoms of patients had improved, the lung CT of some patients remained abnormal, and the main abnormal manifestations were GGOs and fibrosis, while patients who recovered completely on lung CT were primarily in the ordinary oxygen inhalation group. During the recovery course of the disease, fibrotic lesions gradually increased, and some were then resolved tardily. We observed a larger range of lung lesions and more pronounced fibrosis in patients who had received ventilator assistance. The main features were the subpleural line and parenchymal bands, which were more pronounced in the double lower lungs. According to related reports, SARS and MERS patients also had persistent pulmonary fibrosis [22,23]. A considerable proportion of patients surviving the acute illness suffered impairment in respiratory functional capacity and health status after discharge from the hospital [24]. Whether these patients’ lung fibrosis could be resolved and whether lung fibrosis would affect the patient’s permanent lung function warrant further exploration.
The limitations of this study are as follows. First, the data were obtained at a single center with a limited sample size. Second, as an observational study, it was difficult to accurately assess the efficacy of corticosteroids and antiviral and other treatments. Third, there were many interference factors during treatment, including the patient’s own characteristics and the diversity of treatment. Due to limited time, chest CT scanning could not be further reviewed after discharge, and there was insufficient information on the progress of the pulmonary lesions.
CONCLUSION
Critically ill patients who required ventilator assistance for COVID-19 pneumonia were older and had more comorbidities, worse laboratory test results, and longer hospital stays than those who did not require ventilator assistance. A great majority of patients continued to show abnormal lung changes on chest CT when they were discharged. Among the changes, pulmonary fibrosis was obvious, and this topic is worthy of attention.
ACKNOWLEDGEMENT
We respectfully and sincerely thank all front-line medical staff for hard work and sacrifice.
REFERENCES
- (2020) Coronaviridae study group of the international committee on taxonomy of V: The species Severe acute respiratory syndrome-related coronavirus: classifying 2019-nCoV and naming it SARS-CoV-2. Nat Microbiol.
- Steffens I (2020) A hundred days into the coronavirus disease (COVID-19) pandemic. Euro Surveill 25(14): 2000550.
- Fehr AR, Perlman S (2015) Coronaviruses: an overview of their replication and pathogenesis. Methods Mol Biol 1282: 1-23.
- Cascella M, Rajnik M, Cuomo A, Dulebohn SC, Di Napoli (2020) Features, evaluation and treatment Coronavirus (COVID-19). Stat Pearls Publishing, Treasure Island.
- Yang X, Yu Y, Xu J (2020) Clinical course and outcomes of critically ill patients with SARS-CoV-2 pneumonia in Wuhan, China: a singlecentered, retrospective, observational study. Lancet Respir Med, 8(5): 475-481.
- Wang D, Hu B, Hu C (2020) Clinical characteristics of 138 hospitalized patients with 2019 novel coronavirus-infected pneumonia in Wuhan, China. JAMA.
- Namendys-Silva (2020) Respiratory support for patients with COVID-19 infection. Lancet Respir Med 8: e18.
- National Health Commission of China; New coronavirus pneumonia prevention and control program (4th edn).
- WHO (2003) Preliminary clinical description of severe acute respiratory syndrome.
- Zuo MZ, Huang YG, Ma WH (2020) Expert recommendations for tracheal intubation in critically ill patients with noval coronavirus disease 2019. Chin Med Sci J, 2020.
- Hansell DM, Bankier AA, MacMahon H, McLoud TC, Muller NL et al. (2008) Fleischner Society: glossary of terms for thoracic imaging. Radiology 246: 697-722.
- Westcott JL, Cole SR (1986) Traction bronchiectasis in end-stage pulmonary fibrosis. Radiology 161: 665-669.
- Antonio GE, Wong KT, Hui DS (2003) Thin-section CT in patients with severe acute respiratory syndrome following hospital discharge: preliminary experience. Radiology 228: 810-815.
- (2020) Interim clinical guidance for management of patients with confirmed coronavirus disease (COVID19).
- Gattinoni L, Chiumello D, Caironi P (2020) COVID-19 pneumonia: different respiratory treatments for different phenotypes? Intensive Care Medicine 46(6): 1099-1102.
- Huang C, Wang Y, Li X (2020) Clinical features of patients infected with 2019 novel coronavirus in Wuhan, China. Lancet 395: 497-506.
- Guan WJ, Ni ZY, Hu Y (2020) Clinical characteristics of coronavirus disease 2019 in China. N Engl J Med 382: 1708-1720.
- Henderson LA, Canna SW, Schulert GS (2020) On the alert for cytokine storm: Immunopathology in COVID-19. Arthritis Rheumatol 72(7): 1059-1063.
- Wang Y, Dong C, Hu Y (2020) Temporal changes of CT findings in 90 patients with COVID-19 Pneumonia: A longitudinal study. Radiology 296(2): E15-E25.
- Xiong Y, Sun D, Liu Y (2020) Clinical and high-resolution CT features of the COVID-19 infection: comparison of the initial and follow-up changes. Invest Radiol 55(6): 332-339.
- Pan F, Ye T, Sun P (2020) Time course of lung changes on chest CT during recovery from 2019 novel coronavirus (COVID-19) Pneumonia. Radiology 296(2): E55-E64.
- Chan KS, Zheng JP, Mok YW (2003) SARS: prognosis, outcome and sequelae. Respirology 8: S36-40.
- Ajlan AM, Ahyad RA, Jamjoom LG, Alharthy A, Madani TA (2014) Middle east respiratory syndrome coronavirus (MERS-CoV) infection: chest CT findings. AJR Am J Roentgenol 203: 782-787.
- Xie L, Liu Y, Xiao Y (2005) Follow-up study on pulmonary function and lung radiographic changes in rehabilitating severe acute respiratory syndrome patients after discharge. Chest 127: 2119-2124.
Article Type
Research Article
Publication history
Received date: August 11, 2020
Published date: August 24, 2020
Address for correspondence
Shanshan Yu, Department of Emergency, Tongji Hospital, Tongji Medical College, Huazhong University of Science and Technology, China
Copyright
©2020 Open Access Journal of Biomedical Science, All rights reserved. No part of this content may be reproduced or transmitted in any form or by any means as per the standard guidelines of fair use. Open Access Journal of Biomedical Science is licensed under a Creative Commons Attribution 4.0 International License
How to cite this article
Yu Fang, Jingjun Yan, Shuchang Zhou, Gaotan Ke, Dayong Li, Zhigang He, Shanshan Yu. Clinical and CT Features of Critically Ill Patients Requiring Ventilation Who Recovered from COVID-19 Pneumonia. 2020 - 2(4) OAJBS.ID.000209.
Figure 1: Chest CT images before the discharge of patients who received ordinary oxygen inhalation therapy
(group 2).
A. A 51-year-old female COVID-19 patient whose CT scan on the 46th day after onset shows a few small GGOs in
the bilateral lower lobes (black arrows).
B. A 46-year-old female COVID-19 patient whose CT scan on the 26th day after onset shows lesion resolution with a
few parenchymal bands in the bilateral lower lobes (black arrows).
C. A 60-year-old female COVID-19 patient whose CT scan on the 36th day after onset shows lesion resolution with a
subpleural line in the lower lobes (black arrows).
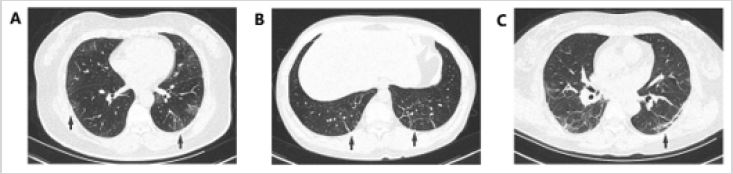
Figure 2: Chest CT images before the discharge of patients requiring ventilation (group 1).
A. A 62-year-old female COVID-19 patient whose CT scan on the 43rd day after onset shows GGOs (white arrows)
and parenchymal bands (black arrows) in lobe.
B. A 70-year-old female COVID-19 patient whose CT scan on the 65th day after onset shows GGOs and
parenchymal bands, and the predominance of GGOs was still obvious and diffuse.
C. A 58-year-old male COVID-19 patient whose CT scan on the 55th day after onset shows few GGOs and
subpleural lines, parenchymal bands, and traction atelectasis (black arrows) in the bilateral lower lobes.
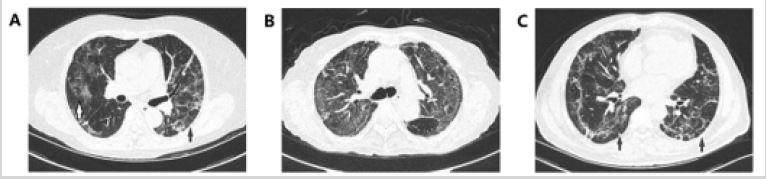
Table 1: General clinical data of patients with COVID-19.
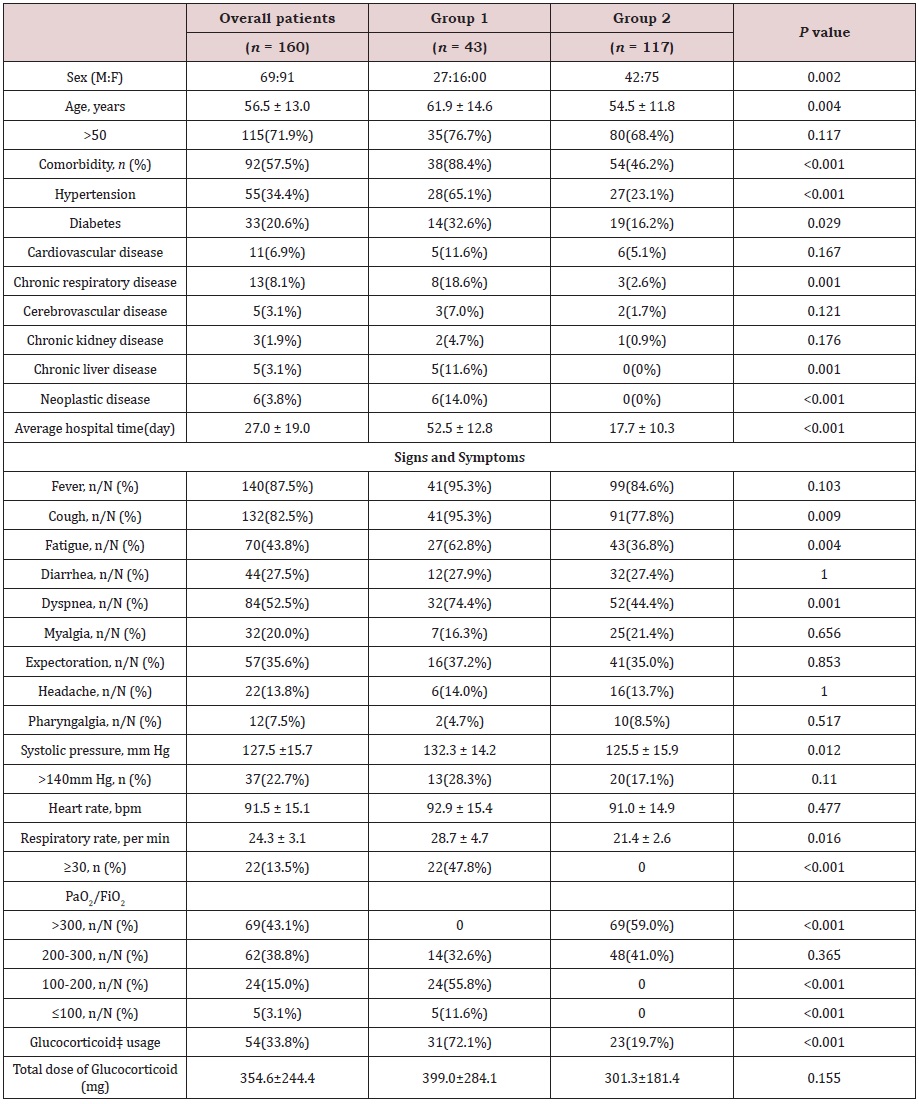
Data were expressed as mean (± SD), median (interquartile range [IQR]) or n/N (%). The p value between the two groups was tested using unpaired 2-sided Student’s t test or Fisher exact test. Glucocorticoid‡: methylprednisolone.
Table 2: Laboratory findings of patients with COVID-19.
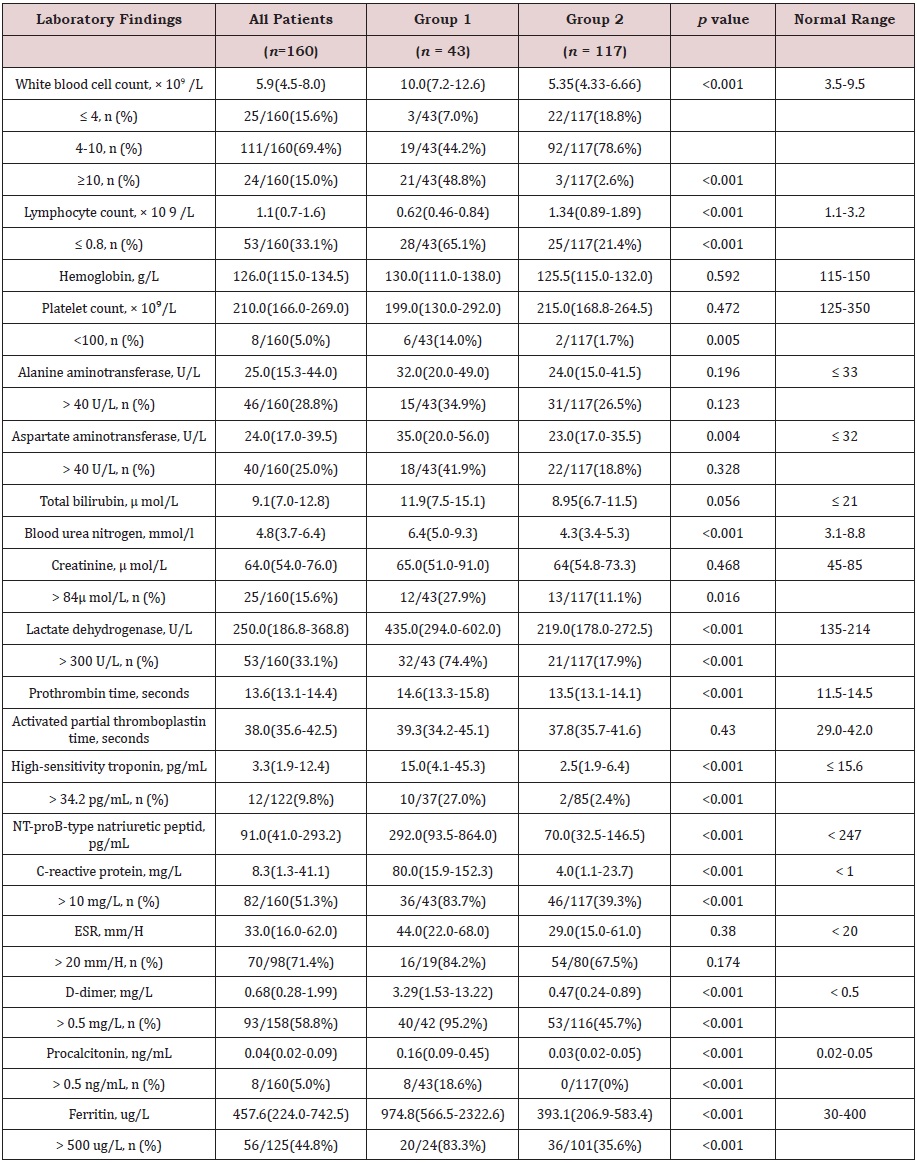
ESR: Erythrocyte sedimentation rate
Data were expressed as median (interquartile range [IQR]) or n/N (%), where N is the total number of patients with
available data. The p value between the two groups was tested using Mann-Whitney U test or Fisher exact test.
Table 3: CT features of the COVID-19 patients before discharge.
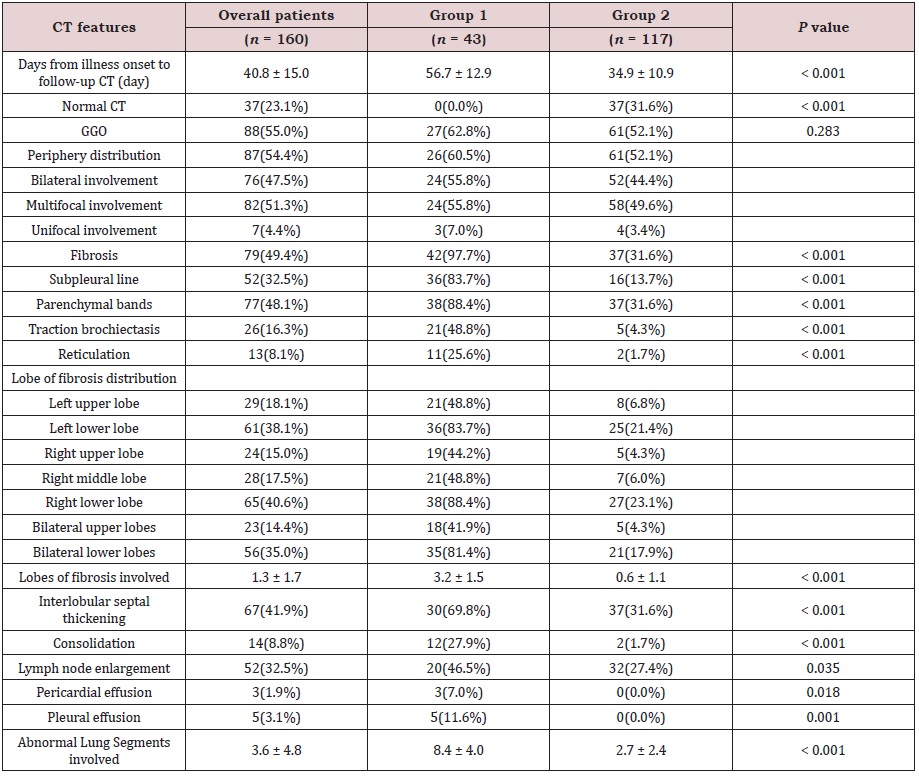
Data are n (%), n/N (%), mean ± SD, where N is the total number of patients with available data. The p value between the two groups was tested using unpaired 2-sided Student’s t test or Fisher exact test.
