
Vaccine Exemptions and Vaccination Coverage in the United States
ABSTRACT
The US has been experiencing a steady decline in vaccination coverage in recent decades. Declining vaccination coverage not only risks individual health but also public health by lowering herd immunity. Reasons from anti-vax sentiments to lack of proper access to vaccines might be responsible for this decline. We study one potential mechanism that might explain variations in vaccine coverage in the US: vaccine exemptions laws. Utilizing state variations in vaccine exemption laws, we study the association between different types of exemptions on vaccination coverage. We also use Indiana’s change in their vaccine exemption law as a natural experiment to detect any causal relationship. Using data from National Immunization Survey, we do not find a strong statistical relationship between vaccination exemption laws and vaccination coverage. While the magnitudes of our difference-indifference estimates are consistent with our theoretical expectations, they are statistically insignificant or weakly significant. Our study suggests that other factors, such as personal beliefs regarding vaccine and alternative channels of being exempt, might be responsible for low coverage rates.
INTRODUCTION
The creation of vaccines at the end of the 1700s has been one of the leading scientific advancements to improve public health. Diseases like smallpox and polio that once plagued humanity with devastating long-term health effects have been eradicated in most countries through the adoption of vaccines. However, despite developments in vaccines, the US has seen a decline in vaccination coverage in recent decades. This could be due to the presence of exemptions to vaccines that help prevent said outbreaks. In the United States there are three available exemptions to vaccination: medical, religious, and personal/philosophical.
This paper tests the impact of vaccine exemptions on vaccination coverage in the US. We use data from National Immunization Survey (NIS) and use multiple regression analysis to see the impact of different vaccine exemption laws on vaccination rates. Any potential differences in coverage rates may be due to factors other than the exemption laws. For instance, a state with religious exemption may also have a higher proportion of “antivaxxers”. To test the direct impact of vaccine exemptions, we use changes in state vaccine exemption laws as a natural experiment. We find no strong relationship between vaccine exemption laws. Our results suggest that there are level differences between states with different types of exemption laws. Finally, we find that other economic factors such as household income, maternal age, and education has a greater impact on vaccination coverage.
BACKGROUND
Vaccination requirements are made by individual states upon recommendations from federal public health officials in the US. The US allows three forms of vaccine exemptions: medical, religious, and personal/philosophical. There is growing concern that vaccine exemptions can lead to lower vaccination coverage rates, lower herd immunity, and lead to outbreaks of preventable infectious diseases. Some states are starting to remove some forms of exemption laws. National estimates suggest that approximately 2.5% of kindergarten children are unvaccinated through some form of exemptions [1]. However, vaccination coverage rates vary across states. This might be due to different exemption laws across states, or due to different population preferences regarding vaccines across states. As of 2018, there are three states that offer only medical exemptions, 29 states (plus the District of Columbia) that offer only medical and religious exemptions, and 18 states that offer all three exemptions. As of 2020, there are four states that offer only medical exemptions, 29 states (plus the District of Columbia) that offer only medical and religious exemptions, and 17 that offer all three exemptions. California, New York, Maine, Washington, Vermont, and Indiana changed their exemption laws. We will use Indiana as our treatment state to conduct our difference in difference analysis due to data limitations at the time of conducting the study. Indiana reformed their law to add religious exemptions to their vaccine exemptions.
METHODS
The data used for this analysis comes from two different sources: the National Immunization Survey (NIS) – Child from the Centers for Disease Control and Prevention and the Federal Reserve Economic Data (FRED). The NIS is a survey for children aged 19-35 months that are living in the United States. The variables UNEMP_ RATE, LFPR, and PCPI are the average annual unemployment rate, average annual labor force participation rate, and average annual per capita income, respectively, for each state for years 2000-2018 and was merged from the FRED.
Our first specification for estimating the effects of vaccine exemptions on vaccination coverage takes the form:
RESULTS & DISCUSSION
Table 1 presents the baseline regression results. The omitted
group is State 1, which is an indicator variable that equals 1 for
a state that only offers medical exemption. We do not see any
statistically significant differences in coverage for most vaccines 
where y_vst is the vaccination coverage of vaccine type v in state s in year t. The binary variable state2 equals 1 if the state has medical and religious exemptions and the binary variable state3 equals 1 if the state has medical, religious, and personal/ philosophical exemptions. Our reference variable is state1, which equals 1 if the state has only medical exemptions. X is a vector that contains the demographic characteristics of state s in year t. Then we have state and time fixed effects α_s and μ_t to account for any characteristics that are not included in the model.
To make a causal interpretation of our estimates, we need states that reformed their policy towards vaccination. While several states have done so, we can only use Indiana because we need several post years following the policy change. Our difference-in-differences model takes the following form:

where the binary variable IN_int equals 1 for Indiana for the years 2009-2018, treatment takes the value 1 if the observation takes place in Indiana, and reform takes the value 1 if the year is after 2008. Vaccination coverage for each vaccine type is calculated by dividing the number of individuals that reported at least one dose of that vaccine at the time of the interview by the total number of observations for that state in that year.
between the three types of states offering exemptions. The only statistically significant vaccine coverage is for Hepatitis A. The states with medical and religious exemptions have an 11-percentage point higher vaccine coverage for Hepatitis A compared to that with only a medical exemption. However, we must not interpret this estimate as a causal estimate.
Table 2 reports the results for Indiana changing their laws. Indiana changed their law to include religious exemptions for vaccines. The coefficients for IN_Int are all negative but not statistically significant in most cases, except for PCV vaccine. The table also shows that coefficient for reform is negative and statistically significant. This implies that Indiana had a lower vaccination coverage rate on average compared to the control group (Figure 1-6).
CONCLUSION
Vaccination coverage rates across all major vaccine groups has been experiencing a sharp decline in recent years. Some researchers argue this is due to vaccine exemptions laws. These state- and individual-level analyses show that exemption availability has little to no effect on vaccination coverage. States with stricter policies that limit availability would, in theory, have higher coverage over states with more exemption options. This analysis, however, shows states with only medical exemptions seem to have lower coverage than the remaining states. We also find that states with different exemption laws do not differ statistically in average vaccination coverage rates. This might be due to other channels of circumventing vaccination requirements that are available to parents and families living in these states.
We would also like to note an interesting result we found from the data. We noticed that around 2011 coverage begins to decrease for all vaccines, some rather drastically. Since we lagged the reform year for Indiana by three years to avoid biasing our estimates, we questioned what happened roughly three years before this reduction in coverage: Great Recession of 2008. Further research must be done to disentangle the effects of the Great Recession and the impact of the anti-vax movement on changes in vaccination coverage in the US.
REFERENCES
Article Type
Research Article
Publication history
Received Date: November 17, 2021
Published: December 02, 2021
Address for correspondence
Agnitra Roy Choudhury, Department of Economics, Auburn University at Montgomery, USA
Copyright
©2021 Open Access Journal of Biomedical Science, All rights reserved. No part of this content may be reproduced or transmitted in any form or by any means as per the standard guidelines of fair use. Open Access Journal of Biomedical Science is licensed under a Creative Commons Attribution 4.0 International License
How to cite this article
Gavin P, Agnitra RC. Vaccine Exemptions and Vaccination Coverage in the United States. 2021- 3(6) OAJBS.ID.000355.
Figure 1: Average measles- containing vaccine coverage.
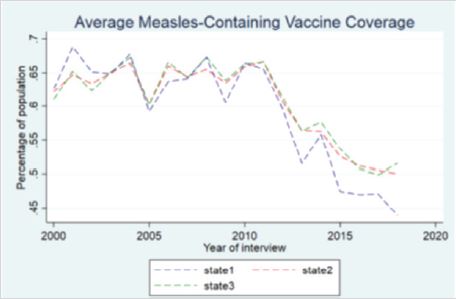
Figure 2: Average DT- containing vaccine coverage.
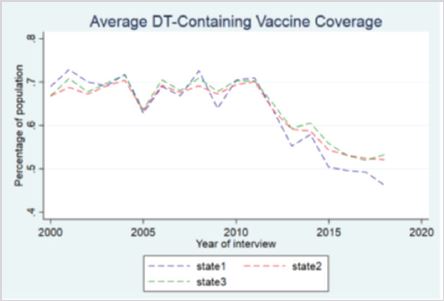
Figure 3: Average varicella-containing vaccine coverage.
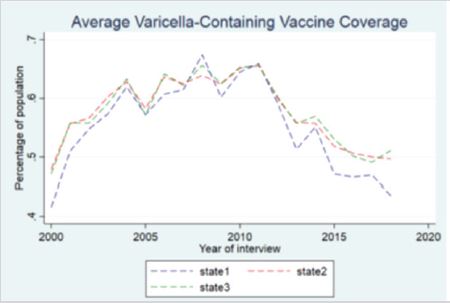
Figure 4: Average polio-containing vaccine coverage.
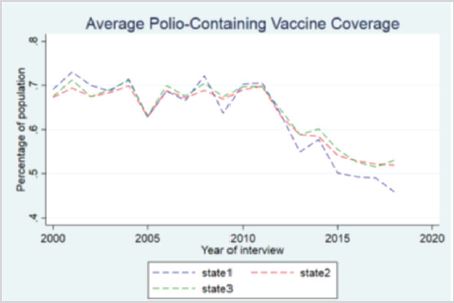
Figure 5: Average Hib-containing vaccine coverage.
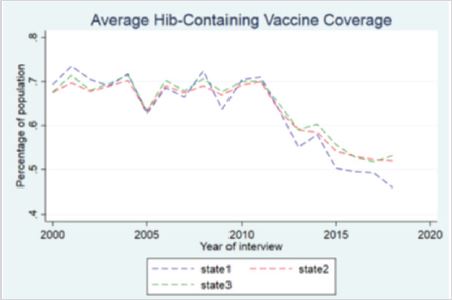
Figure 6: Average pneumococcal-containing vaccine coverage.
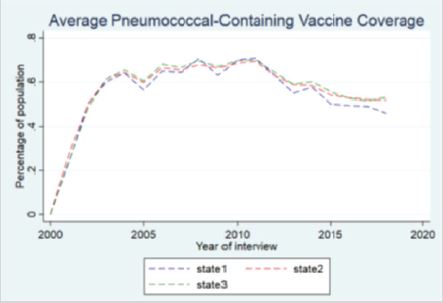
Table 1: Vaccination coverage difference estimation by exemption status at the state level.
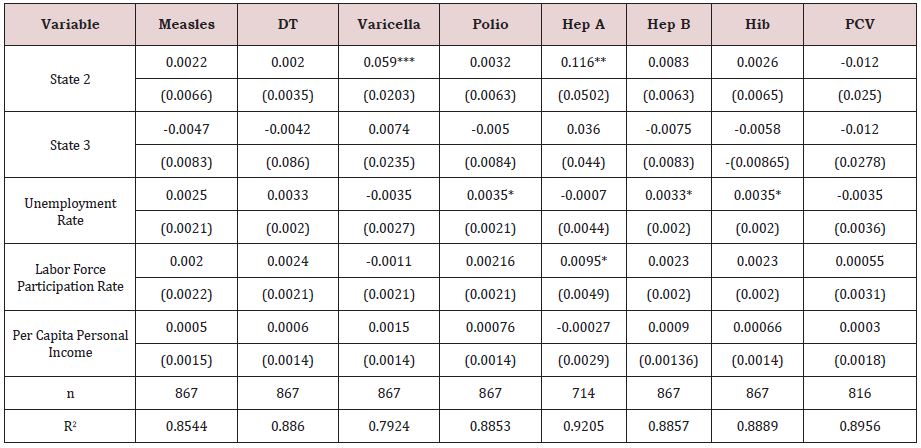
Note: ***, **, and * denote statistical significance at the 1%, 5%, and 10% levels, respectively.
Table 2: Vaccination coverage difference-in-difference estimation at the state level.
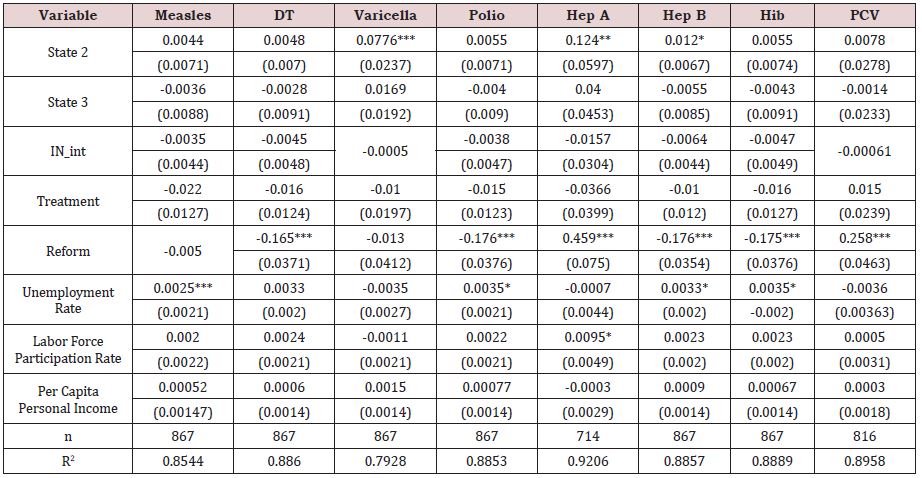
Note: ***, **, and * denote statistical significance at the 1%, 5%, and 10% levels, respectively.
