The Comparison Between Seven Quality Tools on their Effectiveness in Health Care Quality Management
ABSTRACT
Background and Objective: The main theme of this article is to discuss the comparison between seven quality tools on their
effectiveness in Health care quality management.
Methods: The Author of this article has chosen literature review methodology of random research articles about the comparison
between seven quality tools on their effectiveness in Health care quality management. 23 PubMed articles and some websites are
searched with the keywords 7 Quality tools, Ishikawa diagram, histogram, healthcare, control chart. Scatter diagram. Articles were
read and the significance and benefits of quality tools are mentioned in this article. Tables and SPSS diagrams clearly indicates that
how much beneficial are the quality tools for the healthcare industry and for the patients as they receive the improved healthcare
services.
Results: The author has presented two tables one is regarding the benefits of seven quality tools and other one discusses the
five strategies to improve the quality management. The two SPSS Diagrams represents the frequency of 10 benefits of 7 quality
tools discussed in the 23 Articles and websites. Second SPSS Diagram represents the frequency of 5 strategies discussed in the 23
Articles and websites. Overall, the aim is to highlight the benefits of using seven quality tools and discuss the best strategy for quality
improvement.
Conclusion: To conclude, during the time of recession and economic instability most of the organizations are looking to save
money. Debate is that in health care business the customer satisfaction is most important and there are rare chances of errors. The
seven quality tools and other 29 administrative quality tools help the organizations to identify the problem, its root cause analysis
and implement the corrective action to obtain the best possible result. Kaizen tool or the continuous improvement process helps to
monitor and to do improvement in daily basis till the desire task is achieved.
KEYWORDS
Quality tools; Seven quality tools; Histogram; Ishikawa diagram; Healthcare; Pareto diagram health; Check sheet; Flow diagram health; Scatter diagram; Control chart
INTRODUCTION
The seven basic tools of quality are a [1] designation given to a fixed set of graphical techniques identified as being most helpful in troubleshooting issues related to quality. The designation arose in postwar Japan inspired by the “seven famous weapons of Benkei”. List of the 7 QC Tools: Cause and [2] Effect Diagram:
(1) Cause and Effect Diagram: also known as Fishbone Diagram helps in identifying the potential causes of an effect or a problem. In addition to sorting ideas in respective categories, it also helps in understanding the areas of opportunity through effective brainstorming. Fishbone training empowers you to identify the potential cause in the problem.
(2) Control Chart: Control charts are used to study how the processes have changed over a period of time. Further, by comparing current data to historical control limits, one could lead to the conclusion about whether the process variation consistent as in under control.
(3) Scatter diagrams: are the best way to represent the value of two different variables. They present the relationship between the different variables and illustrate the results on a Cartesian plane. Then further analysis can be done on the values.
(4) Pareto chart: are charts that contain bars and a line graph. The values are shown in descending order by bars and the total is represented by the line. They can be used to identify a set [3] of priorities so you can determine what parameters have the biggest impact on the specific area of concern.
(5) Flow Chart: it is a chart that describes [4] the flow of the process and the steps and procedure that a product or a service experience, this chart is used to describe the current processes and their sequence.
(6) Histogram: the most commonly used graph for showing frequency distributions or how often each different value in a set of data occurs. And therefore, we can classify the collected data into many categories and in the calculations of frequency, through it we can extract important information about the product or service quality such as the average value of the data (main) and the amount of the differences in the data (Figure 1).
Pre-surgical ADC volumes of 56 HGG patients [5] were analyzed by histogram-profiling. Association between extracted histogram parameters and neuropathology including WHO-grade, Ki-67 expression and MGMT promotor methylation status was investigated due to comparative and correlative statistics. ADC histogram parameters differ significantly between glioblastoma and anaplastic astrocytoma and show distinct associations with the proliferative activity in both HGG. Our [6] results suggest ADC histogram profiling as promising biomarker for differentiation of both.
METHODS
The Author of this article has chosen literature review methodology of random research articles about the comparison between seven quality tools on their effectiveness in Health care quality management. 23 PubMed articles and some websites are searched with the keywords 7 Quality tools, Ishikawa diagram, histogram, healthcare, control chart.
Scatter diagram. Articles were read and the significance and benefits of quality tools are mentioned in this article. Tables and SPSS diagrams clearly indicates that how much beneficial are the quality tools for the healthcare industry and for the patients as they receive the improved healthcare services.
In addition to the standardized steps of outbreak investigation, [7] the complementary use of quality management tools such as the Ishikawa “fishbone” analysis is helpful for outbreak control. Then, a systemic quality management approach with “fishbone” analysis was added. An Ishikawa diagram, also known as a causeand- effect diagram or [8] fishbone diagram, is often used in quality management in manufacturing industries (Figure 2).
We make use of the example of organizational [9] food safety culture failures and the lack of managerial engagement which resulted in a multi-state listeriosis outbreak in USA. Moreover, we correlate this with microbiological criteria. Implementation of food safety management systems (ISO 22000:2018) along with incorporation of management tools such as HAZOP, FMEA, Ishikawa and Pareto have proved to be proactive in the maintenance of a positive food safety culture and prevention of cross contamination and fraud (Figure 3).
ADC histogram-profiling is a valuable [10] radiomic approach, which helps differentiating tumor grade, estimating growth kinetics and probably prognostic relevant genetic as well as epigenetic alterations in LGG. Pre-treatment ADC volumes of 26 LGG patients were used for histogram-profiling. WHO-grade, Ki-67 expression, IDH mutation, and MGMT promotor methylation status were evaluated. Comparative and correlative statistics investigating the association between histogram-profiling and neuropathology were performed.
MEASURE AND STATISTICAL ANALYSIS
Table 1&2, Figure 4&5
RESULTS
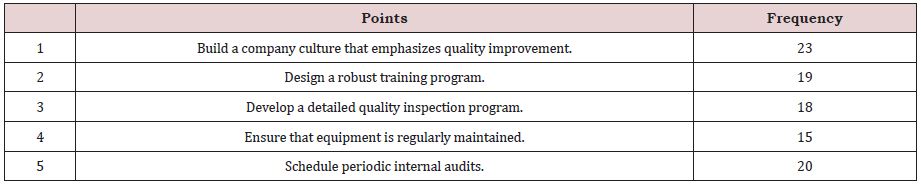
The author has presented two tables one is regarding the benefits of seven quality tools and other one discusses the five strategies to improve the quality management. The two SPSS Diagrams represents the frequency of 10 benefits of 7 quality tools discussed in the 23 Articles and websites. Second SPSS Diagram represents the frequency of 5 strategies discussed in the 23 Articles and websites. Overall, the aim is to highlight the benefits of using seven quality tools and discuss the best strategy for quality improvement.
The Ishikawa diagram like most quality [11] tools is a visualization and knowledge organization tool. Still there is room for improvement of adequate reporting of flow diagrams [12] RCTs to increase transparency of trials details. Median recruitment was 73% (IQR 44–91%), and retention was 97% (IQR 93–100%). These rates did not change over time. Trials with adequate reporting of participant flow were more likely to report a statistical strategy (41% vs 8%), reasons for post-randomization exclusions (100% vs 55%) and handling of missing outcome data (14% vs 6%). Control charts could prove valuable given their [13] potential ease of use and interpretability in real-time decision-making and for communication about the pandemic at a meaningful level for communities (Figure 6).
Different organizations around the globe are [14] using 5S and 7 Muda methodology to get benefits for improvement of their health care system. Table title is (18 journal articles discusses and agrees to the following 10 points). The 10 points includes the agreement of points beneficial for health sector by using 5S and 7 Muda methodology.
DISCUSSION
The modified fishbone diagram is a [15] useful tool to identify various categories of errors on diagnostic process in emergency department (ED). These findings provide a basis on which to build a framework for teaching EPs how to avoid misdiagnoses in the ED setting. Sixty-one cases of diagnostic errors involving ten boardcertified emergency physicians (EPs) were identified through a peer review process. All interview audiotapes were transcribed verbatim. Content analysis was performed on all textual data to identify the factors underlying errors using the modified fishbone diagram.
Lean management and Lean six sigma methodology [16] has shown promising results to improve the quality of health care system. Authors are recommended to use flow diagrams to [17] present the review process, allowing for better understanding among readers.
The literature review of the PESTEL/PESTLE analysis tool [18] helps the organization to focus on 6 important factors to grow the business. 6 important factors include political focus on health care, economic challenges, social factors, technological factors, legal factors, and the environmental factors. The government policies, Inflation and unemployment, demographics (age, gender, race, family size), new ways of producing and distributing goods, carbon footprint targets and health and safety rules are very important. Step by step process, attitude of learning, continuous improvement, not giving up, RCA, FOCUS PDCA, 7 quality tools, (23) Ahsan Siddiqui) 25 administrative quality tools are all helpful to make an organization business successful.
Based on phantom studies scatter imaging is a [19-23] potential technique for marker less lung tumor tracking during SBRT without additional imaging dose. Quality scatter images may be collected at low clinically relevant doses (10 MU). Scatter images are capable of sub-millimeter tracking precision, but modulation decreases accuracy. Scatter images were collected during the irradiation of phantoms with megavoltage photons. To assess scatter image quality, spherical phantom lung tumors of 2.1-2.8 cm diameters were placed inside a static anthropomorphic phantom.
CONCLUSION
To conclude, during the time of recession and economic instability most of the organizations are looking to save money. Debate is that in health care business the customer satisfaction is most important and there are rare chances of errors. The seven quality tools and other 29 administrative quality tools help the organizations to identify the problem, its root cause analysis and implement the corrective action to obtain the best possible result. Kaizen tool or the continuous improvement process helps to monitor and to do improvement in daily basis till the desire task is achieved.
REFERENCES
- Sketch bubble (2021) 7 Quality control tools.
- Wikipedia Article (2021) Seven basic tools of quality.
- 4C Consulting (2020) 7 QC tools for quality improvement with a strategic plan.
- Tallyfy.com (2021) 7 Basic quality tools for process and product improvement.
- Bakkah learning programs (2021) What are the 7 Basic Quality tools?
- Georg G, Diana H R, Elena H, Oliver G, Hans H et al. (2021) Diffusion weighted imaging in high-grade gliomas: A histogram-based analysis of apparent diffusion coefficient profile. PLoS One 16(4): e0249878.
- Luzia V, Guido S, Stefan K and Marco R (2016) A hospital-wide outbreak of serratia marcescens, and ishikawa’s “fishbone” analysis to support outbreak control. Qual Manag Health Care. 25(1): 1-7.
- Kam C Wong (2011) Using an Ishikawa diagram as a tool to assist memory and retrieval of relevant medical cases from the medical literature. J Med Case Reports 5: 120.
- Jocelyn CL, Aura D, Chrysa V, Georgios R, Hesham AE, et al. (2021) Implementation of food safety management systems along with other management tools (HAZOP, FMEA, Ishikawa, Pareto). The case study of listeria monocytogenes and correlation with microbiological criteria. Foods 10(9): 2169.
- Georg AG, Diana HR, Elena H, Oliver G (2020) Histogram analysis of diffusion weighted imaging in low-grade gliomas: in vivo characterization of tumor architecture and corresponding neuropathology. Front Oncol 10: 206.
- Luis L Flávio H, Marivaldo O, Waldir P (2021) Use of the Ishikawa diagram in a case-control analysis to assess the causes of a diffuse lamellar keratitis outbreak. Arq Bras Oftalmol 80(5): 281-284.
- Thea NR, Jens L, Casper P, Ole M (2021) Adherence to participant flow diagrams in trials on postoperative pain management after total hip and knee arthroplasty: a methodological review. Trials 2021; 22: 280.
- Moira I, Cheríe B, Daisuke F, Vladimir G. M et al. (2021) Using control charts to understand community variation in COVID-19. PLoS One 16(4): e0248500.
- Ahsan S (2021) Comparing the workplace organization method 5s with the 7 wastes (Muda) in waste and failure management tool, in the health care quality management. Biomed J Sci & Tech Res 40(1): 31825-31831.
- Chih S, Chien C, Yu Y, Chi P Cho F, et al. (2017) Use of a modified fishbone diagram to analyze diagnostic errors in emergency physicians. J Acute Med 7(4): 149-157.
- Ahsan S (2021) Examples of lean management or lean six sigma methodology to improve health care and patient safety standards in the health department. Am J Biomed Sci & Res 14(6): AJBSR.MS.ID.002045.
- Hai Vu N, Sameh SE, Ghaleb MM, Amr HA (2018) Quality of flow diagram in systematic review and/or meta-analysis. PLoS One. 2018; 13(6): e0195955.
- Ahsan S (2021) The use of pestel analysis tool of quality management in the health care business and its advantages. Am J Biomed Sci & Res 14(6): 002046.
- Kevin CJ, Julius T, Gage R, Gizem C (2020) Scatter imaging during lung stereotactic body radiation therapy characterized with phantom studies. Phys Med Biol 65(15): 155013.
- Leansixsigmadefinition.com (2021) Fishbone diagram.
- Wikipedia Pareto chart 80-20 rule (2021) A Pareto chart is a type of chart that contains both bars and a line graph.
- Vahid B, Hamideh D (2014) A decision support system for monitoring traffic by statistical control charts.
- Quality Management (2017) 5 Strategies to improve your approach to quality management.
Article Type
Research Article
Publication history
Received Date: December 02, 2021
Published: December 22, 2021
Address for correspondence
Ahsan Ali Siddiqui, Consultant Public Health, Quality Management & Patient Safety Department, General Directorate of Health, Saudi Arabia
Copyright
©2021 Open Access Journal of Biomedical Science, All rights reserved. No part of this content may be reproduced or transmitted in any form or by any means as per the standard guidelines of fair use. Open Access Journal of Biomedical Science is licensed under a Creative Commons Attribution 4.0 International License
How to cite this article
Ahsan AS. The Comparison Between Seven Quality Tools on Their Effectiveness in Health Care Quality Management. 2021- 3(6) OAJBS.ID.000364.
Figure 1:
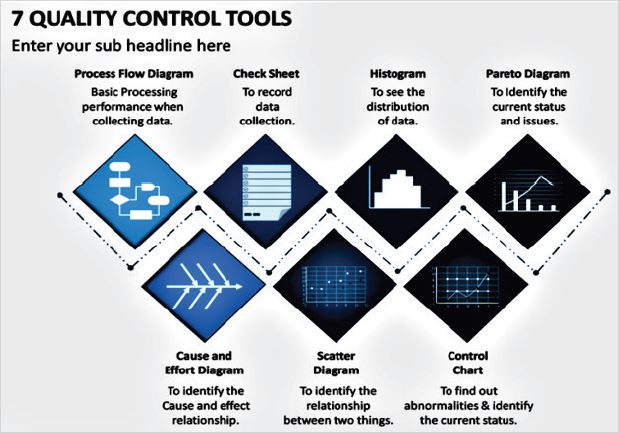
Figure 2:
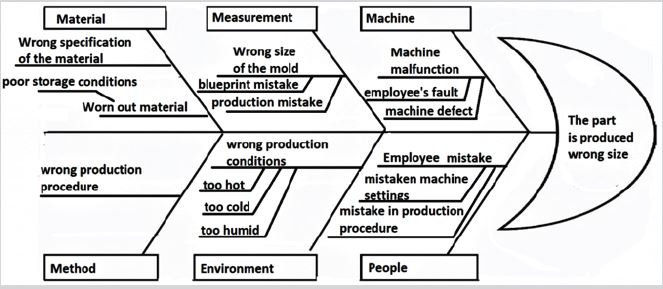
Figure 3:

Figure 4: SPSS Diagram regarding showing frequency of 10 principles of kaizen and agrees to the following 10 points.
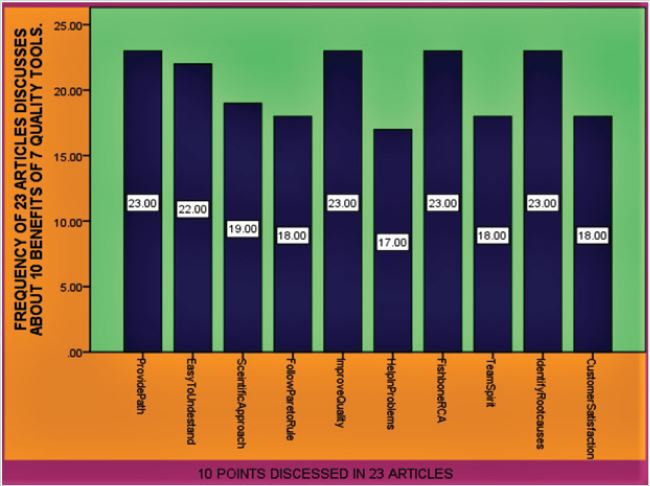
Figure 5: SPSS Diagram regarding showing frequency of 10 Benefits of KAIZEN and agrees to the following 10 points.
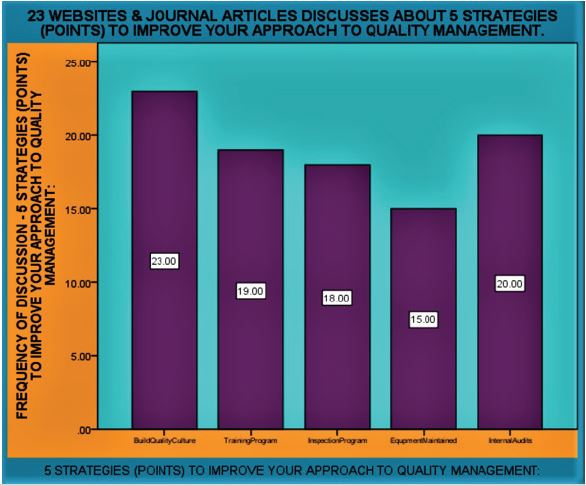
Figure 6:
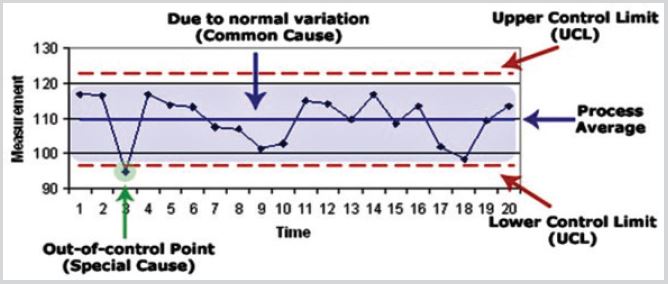
Table 1: 23 Websites & journal articles discuss about 10 benefits of 7 quality tools and agrees with it.
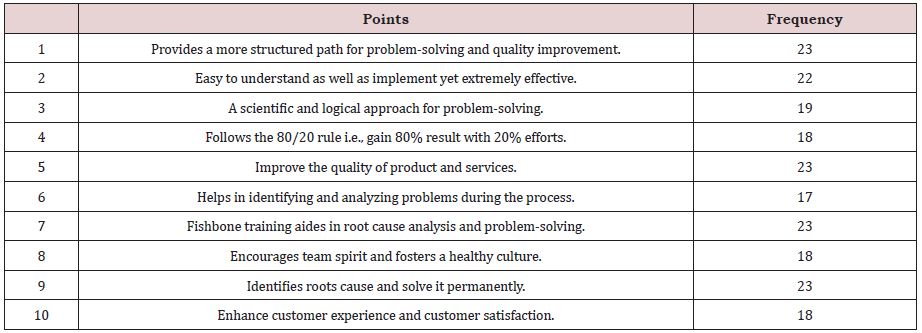
Table 2: 23 websites & journal articles discuss about 5 strategies to improve your approach to quality management: (quality management, 2017).