Statistics in Health... Is There a Connection Between School and Workplace Statistics?
ABSTRACT
Research to determine the use of statistics in health carried out by health professionals in their workplace was carried out, concerning statistical techniques, research methods by a survey in 2019. This article reports three main findings. So far, (i) describes the needs and the opinions of the health professionals, (ii) goes to the training programs and identifies if the needs are covered by the training programs, and (iii) implements corrective measures to overcome the need not covered by the training programs. The research identified gaps between subjects and methods taught at university and the ones used in the workplace by health professionals. In the health professionals’ opinion there is inadequate statistics education for alumni during their studies. Based in their opinion, researchers identified some changes to courses programs which should be implemented.
KEYWORDS
Statistics education; Statistics in the workplace; Health professionals; Curriculum development; Workplace needs
INTRODUCTION
According to Ocaña-Riola et al. [1] the bases of statistical inference and contemporary statistics were set in the early 20th century. Straightaway, these statistical methods were used in health research but almost immediately Fisher [2] warned that mistakes were being made. Furthermore, during the second half of the 20th century, there was a remarkable surge in scientific evidence alerting to the errors that many researchers were making in applying basic statistical methods [and that] this issue became so serious that Douglas Altman, Director of the Centre for Statistics in Medicine in Oxford, qualified inappropriate use of statistical techniques in biomedical research as a scandal, in one of the most striking articles for the scientific community published in the 1990s. Given that many medical decisions, including disease diagnosis and choice of appropriate treatment, were based on statistical tests, this situation took on a very serious note.
Ocaña-Riola [1] says that the reason for the mistakes made by researchers and health professionals who use statistical methods is the lack of training and knowledge in the field of mathematics (which includes the area of statistics), and as a result, the findings only contribute further to spreading false conclusions. The statistical community and the spread of information about the lack of statistical knowledge which caused poor decision-making led to question whether the mathematical content embedded in working practices is widely understood or achieved by a small number of experts. To quote a National Research Council workshop report,
Mathematics in the workplace is quite different from mathematics in school. It is more concrete and more intuitive, yet at the same time more exacting and more unpredictable. It is rich in data and inextricably linked with technology. Technicians and other workers are routinely expected to carry out multistep applications of simple mathematics--especially three-dimensional geometry, triangle trigonometry, and elementary data analysis [3].
Statistics education is a necessary element of health professionals’ education. Given the need to ensure professional practice based on evidence, they need to know how to interpret statistical information, especially in scientific studies of healthrelated specialties, in order to better exercise their profession. In this sense, they must be statistically literate to be able to interpret the data resulting from research and practice and conveyed in meetings and scientific articles. Thus, being statistically literate is a minimum requirement, for health professionals to develop their statistical reasoning. As decision-makers, health professionals must develop some knowledge in statistics [4], which includes one or more of the following skills: literacy, reasoning, and thinking.
Firstly, health professionals should develop sound statistical knowledge to be informed consumers. Like any other tool, statistics can be used or misused. It is true that some individuals do actively lie and mislead the public with statistics. More often, however, wellmeaning individuals unintentionally report erroneous statistical conclusions. It is fundamental that everyone, and, in particular, health professionals, knows some of the basic statistical concepts, in order to be in a better position to evaluate the information that is given.
Secondly, health professionals need to be able to read and understand articles in scientific journals. Almost all technical journal articles contain some form of statistics. When readers are deprived of an understanding of statistics, the information contained in scientific articles will be worthless and can be wrongly comprehended.
From Brown’s [4] point of view, an understanding of basic statistics will provide health professionals the fundamental skills necessary to read, understand, and evaluate most results. Furthermore, the ability to understand, interpret and critically evaluate research from a statistical perspective are fundamental skills that facilitate understanding throughout coursework in their formative path.
Thirdly, health professionals must be able to effectively conduct research. They must know what statistics they need to use before they collect data, since, otherwise, the data collected might be uninterpretable. Unfortunately, when this happens it results in a loss of data, time, and money. Even during their training, conducting research is a requirement (for instance, designing and conducting a final research project).
Finally, statistical knowledge further develops critical and analytic thinking skills. Although, most students completing high school and introductory undergraduate course works have at their disposal a variety of critical thinking and analytic skills, the study of statistics will serve to enhance and further develop these skills. To do well in statistics one must develop and use formal logical thinking abilities that are both high level and creative.
In Portugal, statistical knowledge has become a leverage for the career of health professionals. On one hand, health professionals are demanded to interpret statistical data and draw conclusions based on statistical information; on the other hand, they are required to engage in statistical investigations, which include data collection, processing, and analysis. In particular, being statistical literate assists health professionals in decision-making processes and works as an important tool to conduct research and correctly interpret evidence-based readings.
Most Portuguese graduate programs in Health Sciences require one or more courses in statistics in order to prepare students to engage in statistical investigations and make sense of data. This does not mean that all health professionals will engage in statistical research in their profession, but rather that they have the means and tools to do it, in case it becomes necessary. Those statistics courses have a dual focus. On one hand, they focus on the mathematical theory of statistics, which is typically not contextualized in realworld situations. On the other hand, they focus on how to use statistics (e.g., how to design an experimental study, how to select a proper statistical method, or how to interpret statistical reports in a scientific paper). The Bologna reorganization of higher education offered the opportunity to emphasize the practical aspects of statistics and contextualize the learning of statistics in real-world situations, engaging students in solving problems involving realworld, complex data. Yet, statistics courses in most graduate Health Sciences programs still separate theory from practice, in such a way that students feel there is no usefulness in understanding the mathematical theory behind the statistical procedures they learn to master.
In the first author’s experience as a teacher and as a statistical consultant, the statistics education that health professionals encounter in their formative path, in higher education institutions, has a rather theoretical character, and much of what they learn is hardly ever used at the workplace. This is not so regarding descriptive statistics, but considering factual experience and health professionals’ opinions, it is true concerning inferential statistics. Thus, health professionals must develop a significant autonomy in searching the statistical methods that better suit the complex situations they encounter at the workplace. Health professionals do have to become competent in designing and conducting scientific research, involving statistical notions and making sense of data, as well as in developing an investigative, reflective, and critical stance towards data and statistical information. Therefore, they have to move beyond being statistical literate to developing their statistical reasoning. In brief, being statistical literate is necessary for all citizens and primordial to health professionals, even those who do not carry out research, because if they want to fulfill their professional tasks with quality, being able to interpret and understand statistical data about, for instance, drugs, diseases, etc., is a basic requirement. Statistical reasoning involves an explicit process where facts are identified, relationships are established, and inferences are made.
The Bologna agreement recommends the creation of a learning environment that favors classroom interaction and student participation in class discussions, moving away from direct teaching approaches. Yet, in our view, the document has had a practical expression lined much more to reorganization and restructuring than to changes in learning environments and teaching approaches. There have been more modules in the course structure, but this means more segmented content matrices, with no significant changes in the general content matrix and leading to compartmentalization instead of integration. Class size has diminished, but typical approaches are based on lectures, focusing on subject-matter, not on real-world problem situations, which should be tackled and discussed collectively, from a critical stance. Thus, the focus is essentially subject-based, rather than problembased, that is, the emphasis is on learning theoretical statistical notions, instead of being on problem-solving processes using statistics.
Subject-based approaches are efficient and required. Nonetheless, the heavy focus on course program/content may harm further learning by leaving students with the impression that they have learned all that is worth knowing about statistics. Furthermore, if the statistical concepts are not incorporated in their knowledge and future problem practice, it may be difficult for professionals to recall and apply these concepts later, in the workplace. On the contrary, courses taught using problem-based learning methods give health sciences graduate students direct practice with the statistical reasoning skills needed to choose appropriate procedures for analyzing data from their research studies and give them a sense of purpose in their learning of statistics. Considering the current need to make decisions based on evidence, it seems to be urgent to make real the promise left by the Bologna agreement.
Medical science is, in its nature, inseparable from an understanding of probability to interpret data and therefore to draw valid conclusions. Even so, most doctors know little about statistics, struggling with it even in their own specialty [5,6]. Research has documented difficulties in understanding probability and in reasoning about chance events [7,8] distributions, and graphical representations of distributions [9], which are basic notions underlying core statistical concepts. Such difficulties necessarily lead to obstacles in learning statistics. In fact, studies have pointed out that both health professionals and students frequently misunderstand health statistics themselves.
Attitudes of health professionals and students towards statistics are often unfavorable [10-15]. Attitude can be defined as a disposition to act in a certain manner in precedence to others, depending on the experience one has of the situation about to face [16]. There is a crescent number of studies suggesting the existence of positive attitudes among health professionals and students towards statistics, along with a clear recognition of its importance [17]. Many, however, still experience anxiety and consequently show negative attitudes towards statistics. In fact, several practitioners and students in health sciences training, including in medical schools, frequently find statistics courses far too challenging, probably because of their perceptions of the subject’s difficulty and their lack of a solid background in mathematics [18]. In multiple domains, attitudes towards statistics are positively correlated with statistical knowledge [19]. These attitudes are also related to attitudes regarding scientific research as a whole [20]. However, during a statistics course, positive attitudes have been shown to improve over time, alongside with students’ proficiency [21].
This study is drawn from the implications of the first author’s experience as a teacher and as a statistical consultant involving health professionals. Based on the first author’s experience as a statistics teacher in higher education institutions, in the health sciences area, there seems to be a lack of adequacy of statistics courses in health sciences programs, in terms of preparing health professionals to exercise their profession appropriately equipped with statistical knowledge. In some cases, there seems to be even a complete absence of statistics preparation of health professionals in order to become competent in their future professional practice. Based on the demand for statistical treatment based on the demand for statistical data treatment by health professionals, either during the year of specialty, or when the theses dissertation, or just for data treatment for congresses and publications, the demand for statistical treatment is very high, just look at the number of companies that provide statistical consultancy services and their demand. ASA [22], states that “Statistician is listed among the Bureau of Labor Statistics’ fastest growing careers in 2018 and it’s predicted to grow 33 percent by 2026”.
Research goal and questions
In this article, we examine the relationships between the statistical education of health professionals and the statistics used in the workplace, from the perspective of those professionals. Our study was guided by the following research questions:
1) How do health professionals perceive the contents and
methodologies used in the statistics courses taken throughout their
formative path?
2) How do health professionals assess their own statistical
knowledge at the end of their graduate program?
3) What statistical notions and methods do health
professionals use in their workplace?
4) How do health professionals associate the statistics
used in the workplace with the statistics learned in their graduate
program?
LITERATURE REVIEW
Statistical Literacy, Reasoning, and Thinking
Statistics has a very important role in people’s lives, even though sometimes they don’t recognize it. As a matter of fact, with its ideas and methods, statistics allows the understanding of several aspects of today’s society and facilitates decision-making in a world characterized by uncertainty and variability [23,24]. So, as schools and universities should prepare students for their future, it is fundamental that they promote and develop statistical knowledge [4]. But what is statistical knowledge? Several researchers have distinguished the following notions: statistical literacy, statistical reasoning, and statistical thinking. Yet, according to Ben-Zvi and Garfield [24], there are no consistent definitions of those concepts.
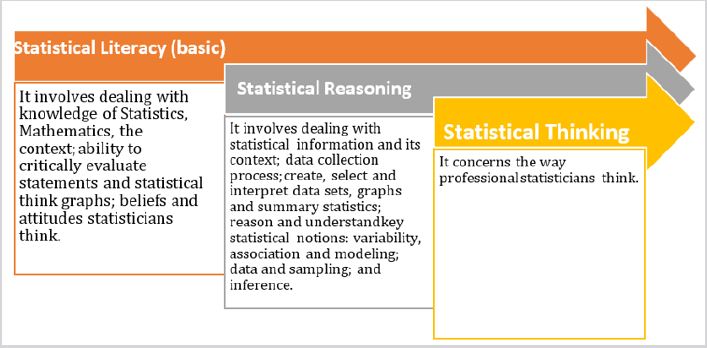
With regard to statistical literacy, these authors state that it includes basic and important skills that may be used in understanding statistical information or research results, such as being able to organize data, construct and display tables, work with different representations of data, an understanding of concepts, vocabulary, and symbols, and “probability as a measure of uncertainty [8]. According to Iddo [25], statistical literacy concerns a person’s ability to be an effective data consumer, e.g., to interpret, critically evaluate, and communicate about statistical information and messages. In a similar approach, Mendonça and Soares [26] perceive statistical literacy as the ability to argue using statistical terminology, in addition to important skills that can be used in the understanding of statistical information. This competence is also associated with the ability to interpret statistics in articles, news, and other sources of information.
With regard to statistical reasoning, Ben-Zvi [8] define and place it on a higher level than statistical literacy, considering that statistical reasoning “means understanding and being able to explain statistical processes and being able to fully interpret statistical results” Iddo Gal [25], for his part, argues that it involves mathematical reasoning and making sense of statistical knowledge. In particular, it involves a mixture of ideas about data and chance. Garfield [27] defines statistical reasoning “as the way people reason with statistical ideas and make sense of statistical information, [which] involves making interpretations based on sets of data, graphical representations, and statistical summaries”. A physician faced with a new finding in his field, a pharmacologist analyzing a series of experiments, or a nurse assessing the scientific aspect of the new technique must understand statistical aspects and activate their statistical reasoning.
At a higher and more comprehensive level, there is statistical thinking that encompasses both statistical literacy and statistical reasoning as it “involves an understanding of why and how statistical investigations are conducted and the ‘big ideas’ that underlie statistical investigations” [8]. In addition, according to Iddo Gal [25], statistical thinking is the ability to transform a real-world problem into a statistical problem and to know which method, measure, design, or model applies to this particular problem. So, although these three cognitive processes may be involved in any statistical content, it is possible to distinguish them by analyzing the nature of the task itself. Therefore, to develop statistical literacy, students should be asked to identify some statistical concepts, describe graphs or interpret a result obtained from a statistical procedure. If the purpose is to foster statistical reasoning, students should be encouraged to explain why or how certain statistical results were produced and justify a result or the choice of a representation. Finally, if the purpose is to develop statistical thinking, students should be defied to apply, criticize and assess the conclusions of a study or to generalize the statistical knowledge obtained [8,28]. Ben-Zvi [8] evoke that there are common aspects among statistical literacy, reasoning, and thinking, but they argue that there is a hierarchy among the three competencies mentioned above. Figure 1 depicts such hierarchy.
Garfield [29] as well as [30] discuss the development of these three interrelated statistical competencies: from statistical literacy to statistical reasoning and statistical thinking, based on the interpretation and critical understanding of information derived from actual data. They suggest that this progress is based on the interpretation and critical understanding of information derived from actual data and is, therefore, associated with an education aimed at the formation of a citizen who critically lives in a society. Snee [22] also argues that by letting students play a more active role in learning statistics and by establishing a greater connection with real-life data and problems, students give greater meaning to statistical tools and concepts, and are closer to experiencing statistical thinking.
Thus, one should work in the classroom with examples that have practical significance for students, where they have to raise problems, formulate hypotheses, collect data, appropriate statistical methods, reflect, discuss and critically analyze the results, considering the limitations with regard to the uncertainty and variability. In sum, the learning of statistics should be based on [29].
According to delMas [31,32], although these three cognitive processes may be involved in any statistical content, it is possible to distinguish them by analyzing the nature of the task itself. Therefore, to develop statistical literacy, students should be asked to identify some statistical concepts, describe graphs or interpret a result obtained from a statistical procedure. If the purpose is to foster statistical reasoning, students should be encouraged to explain why or how certain statistical results were produced and justify a result or the choice of a representation. Finally, if the purpose is to develop statistical thinking, students should be defied to apply, criticize and assess the conclusions of a study or to generalize the statistical knowledge obtained.
Concluding, the main aim of statistics teaching must be not only developing the ability of students to see and read statistical results and data but also to understand and critique them [4].
Statistics Education of Health Professionals
The relevance of statistics in Health Sciences is evident in different ways. For example, when considering the statistics education of health professionals, it can be an important tool to support not only the scientific investigations but also the medical [33,34]. Since their first year at university, health students are expected to deal with various learning materials that contain statistical data. However, the lack of a foundation knowledge and skills in statistics to analyze those materials is likely to lead to a premature negative perception of the subject [35,36]. Thus, it is imperative that this issue is addressed early in the process of training of these professionals, as well as in post-graduate studies, based on the premise that health professionals are not expected to become specialists in statistics, but to be proficient in integrating this knowledge and skills into their everyday practice [37].
In addition, although coursework in medical schools normally comprises biostatistics, which requires a basic knowledge of general statistics, many studies have shown that physicians finish their courses without a strong understanding of statistics [5,6,38- 43]. Moreover, despite being essential to interpret the results of clinical studies [1,13,44,45], some researchers still disregard the need for statistical literacy for judgment and decision making [46].
Finally, Fárdales et al. [32,33] whose study revolves around the main theoretical conceptions supporting the statistical instruction for health students and professionals, defend that the statistical training of the health professional, as a social process, should consider three main aspects. Firstly, statistics training should be asymptotic to the process of training of the medical professionals, consequently responding to its dynamics and to the social requirements of being a doctor, capable of overcoming practice problems. This requires the application of statistical content in various contexts. For example, it is needed: in communication with patients, which involves the explanation of the risk inherent to therapeutics; in the evaluation of the efficacy of a treatment; in the interpretation of the results of diagnostic tests, or simply to understand data in scientific publications. Secondly, statistics training should rely on a methodological approach, since statistics, as a scientific discipline, constitutes a procedural analytical tool that contributes to support the practice of the health professions, emphasizing the role of inquiry, analysis, understanding, assessment, interpretation, and guidance in decision-making. Lastly, statistical education in health should be able to tighten the link between statistics and research processes, as well as between medical practice and social life.
Research has suggested various methods for improving how medical statistics is taught, aiming, on the one hand, to improve performance and, on the other hand, to change opinions that statistics is not important or pointless to practice. However, although some of these recommendations were made some years ago, they are still very updated.
For example, Clayden 1990 suggests the benefits of the collaboration between non‐statistically qualified teachers and medical statisticians, stressing the application of statistical principles to real-and therefore more interesting-medical contexts. Additionally, he states that courses in statistics for health students would be more effective if small group or individualized teaching were used. To help both doctors and statisticians improve the practice of medical statistics, Altman and Bland (1991) propose eight measures: that statistical principles receive greater emphasis in undergraduate medical education; (2) the existence of more post-graduate courses in statistics for doctors; (3) that courses in statistics for medical students and doctors are taught by medical statisticians; (4) the standard improvement of textbooks; (5) that ethics committees pay more attention to statistical aspects; (6) that medical journals observe more carefully the scientific and statistical correctness of the works that they publish; (7) the increase in the number of statisticians in medicine; and (8) the due recognition of the work of medical statisticians by these professionals themselves.
In addition, new teaching strategies of statistics to undergraduate health students have been put to test [36] For example, the use of videos and animations with real-world examples make a difference in the way statistics is seen by students and in how they perform [19]. It is also suggested adopting a practical, applicable, contextual instruction or blended learning over traditional learning [47- 50], as traditional approaches to the learning of statistics do not favor an appropriate development of the ability to reason or think statistically [23].
Concluding, although school and workplaces are both learning environments, they have different activity systems. So, it’s important to consider not only the knowledge of workers but also the codified knowledge of the workplace when teaching [51-64].
METHODS
The focus of our research was on the statistics learned, needed, and used by health professionals, either confident and experienced practitioners or the novices professionals. We therefore recruited as many subjects as possible. This research is a descriptive study for which we employed the web questionnaire method to gather data at a first moment and, in order to collect more data employed, the on-hand questionnaire method in a second moment. Data was collected in August 2019 through October 2019. This resulted in 434 completed and returned questionnaires.
Data was collected using a questionnaire prepared by the researchers in accordance with the literature. An adapted version of the Course Experience Questionnaire (CEQ) developed by Ramsden et al, 1989, was used.
Although CEQ was available for use at the time of elaboration of the form for the questionnaire, in order to construct a more relevant form suitable for the Portuguese context and that may unambiguously accomplish the purposes of the form, five focus group discussions with graduates of different courses were held to identify the major issues and relevant hypotheses that were considered important by the graduates to quality the adequacy of the contents to their job needs.
The questionnaire was adapted and constructed by the first author and then analyzed by the second author. The differences and possible doubts were discussed. Later the questionnaire was sent by email to a small number of subjects (n=6) filling the career criteria. Participants were instructed to write down suggestions when filling out the instrument. No comments about the instrument were made, and in that sense, no changes of any item were made. It was presumed that all health professionals answered the form truthfully to the best of their aptitude, nonetheless, another round of random health professionals (n=3) outside the previous sample was done to check if they understood the questions properly. On average health professionals took about 6 minutes to complete the form.
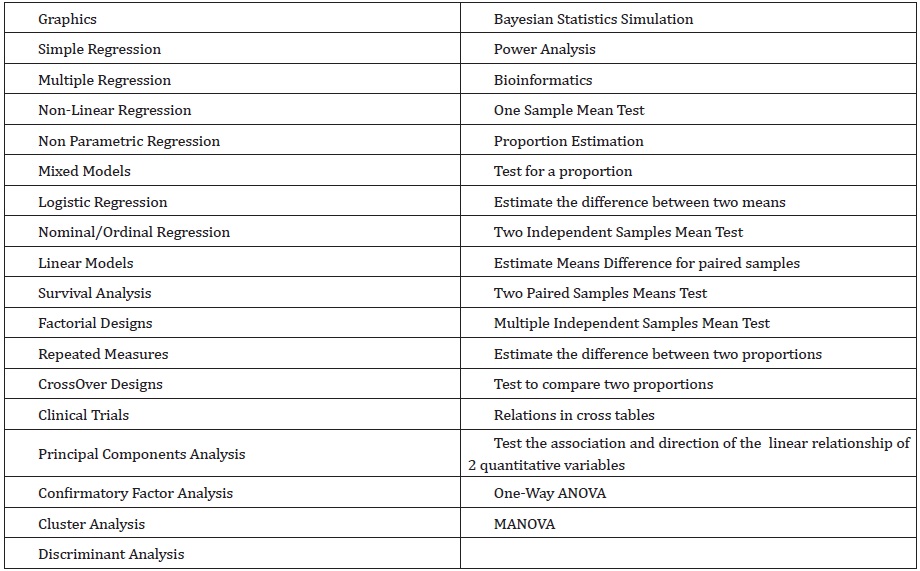
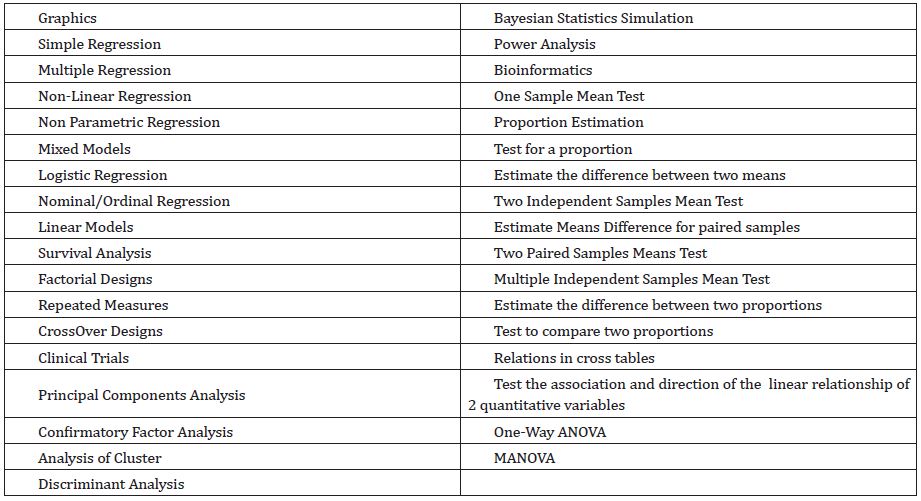
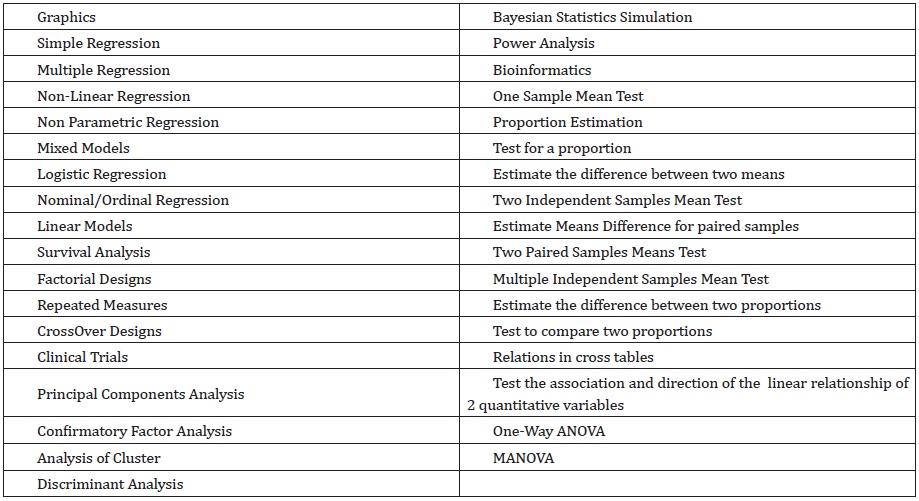
The form comprises six sections. The first section consists of an explanation of the study aim. Section 2 collects details of university degrees, major subject and main field of employment. This key descriptive data was requested in order to provide an accurate representation of the sample. The third section of the form comprises only one question to allow the participants to indicate the statistical techniques and methods used at the workplace. Section 3 aimed to establish the frequency of use in the workplace of 46 statistical techniques and eight computer packages and whether these techniques had been taught at university. Section 4 investigated the type of statistical activity in the workplace, the extent to which statistical help was available in the place of employment, and where and when training in statistics and mathematics had been received at university. Section 5 of the form comprises four questions to better understand the participants’ sensitivity to the use of the learned statistics at the workplace, i.e., the adequacy of the school program and year, the impact in the workplace and circumstances where they used statistical knowledge.
The last section asked respondents for any comments they would like to make about the provision of short courses and workshops, the relevance of statistical training for their employment and recommendations for improving university statistics teaching, as well, participants were invited to enter additional comments, any feedback or thoughts on a free-form text area, which might be used for follow-up for clarification if necessary.
Data Collection
Permission for the study was secured from the Universidade do Porto Ethical Committee (UPEC). A condition was that all information would be confidential and recorded by identification number only. The researchers preferred an online questionnaire as they felt it would improve the response rate, nevertheless they went to the institutions and personally they collected many responses. Further, anonymity and confidentiality were assured and maintained.
Subjects
The target population of our questionnaire comprised health professionals who had in their academic course statistics in higher education curricular program. Professionals were categorized as physician, nurse, and technician. Our sample was constituted by health professionals that were graduated from public Schools of Oporto University. Nonetheless, the target population of the study comprises Portuguese health professionals, the selected sample was composed of the graduates of these three great universities since there will be no major differences with the ones graduated in the rest of the country, as the curricular part of the different courses are similar. We decided for public education, because although there is private education in some of the courses, e.g. nursing, as far as medicine is concerned, there is only public education and therefore we cover all professionals of the same teaching spectrum.
DATA ANALYSIS AND RESULTS
All 434 questionnaires were manually checked for incompleteness and irregularities. All records were entered in a Statistical Package for Social Sciences (SPSS) version 20 for the Macintosh database, and after this procedure, they were checked, and mistakes corrected. SPSS was also used for analysis. Wherever appropriate, Microsoft Excel 2013 was used to modify and create user-friendly charts. The analysis of the quantitative data included descriptive statistics such as frequency and percent. The mean for central tendency and standard deviation for variability were presented.
Demographic Characteristics
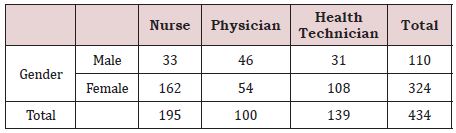
Three hundred and forty-three participants were included in the study, of which 87 were males (25%), with a mean age of 41 years (range: 22–61 years) and 256 were females (85%), with a mean age of 35 years (range: 21–58 years). The characteristics of the respondents are listed in Table 1. There was a predominance of nursing professionals (45%), nevertheless this percentage is very similar when compared to health technicians (32%).
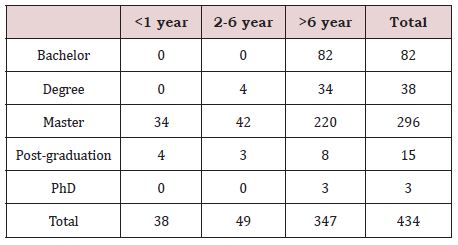
Given the years of work experience, we noticed the predominance of professionals who have been in the career for more than 6 years 347 (80%), with the majority having a master’s degree 296 (68%). It should be noted that among professionals who have been working for less than 1 year, 34 (89%) have a master degree and 4 (11%) have a post-graduation degree, while among professionals whose practice is between 2 and 6 years, 42 (86%) have a master degree, 4 (8%) a degree and 3 (6%) have post-graduation degree (Table 2). Among professionals that work for more than 6 years, the mainstream, 220 (63%) have a master’s degree, 82 (24%) a bachelor’s degree and only 3 (1%) have a PhD. We should notice that 3 health professionals that have a postgraduation degree are physicians and that the professionals that have a bachelor’s degree are nurses.
Type of Statistical Activity in The Workplace
Regarding statistical techniques most widely used in the workplace by the 434 health professionals, 378 (87%) states that introductory methods, counting on descriptive statistics, basic tests, and simple linear regression are taught adequately in university, nonetheless, there is a gap, 273 (63%), in teaching both simple and multivariate non-linear and logistic regression, modeling and others multivariate techniques with an emphasis, 395 (91%) of the respondents stating that exploratory and confirmatory factor analysis wasn’t taught or correctly taught in college, in particular. Meta-analysis should also be taught, in 126 (12%) health professionals’ opinion. 93 (74%) professionals also refer there is a gap in exposure of survey design, power analysis, and simulation.
Concerning statistical procedures and activities carried out in the workplace by the 434 health professionals, the most common activity, 308 (71%), comprises data analyses. Follows the importance in understanding analyses in published research, 179 (58%), and only 14 (8%) of the respondents have no need of statistics. To better realize the reactions summary, we defined 3 classes established by the proportions: > 0.40 as frequently used, from 0.10 to 0.40 as moderately used and < 0.10 as rarely used. The techniques that are more frequently used are graphical procedures, basic tests, analysis of variance and simple linear regression. Multiple regression, multivariate analysis of variance, nonlinear and logistic regression, factorial and repeated measures designs, and principal components are said as moderate used. Some of the techniques rarely used are survival analysis, cross-over designs, path analysis, confirmatory factor analysis, Bayesian statistics, adaptive sampling and bioinformatics.
In the last part of the survey, where health professionals were asked about the adequacy of the year in which statistics are taught in their course, all respondents stated that it was not in the right year, and some added that the statistics should be taught later, 174 (40%) stated that it should be taught at the end of the course and 21 (12%) of the health professionals expressed it should be divided in two parts, a first part in the middle of the course and the second one at the end of the course.
Concerning the courses referred as needed to engage their practice needs, 296 proposed topics regarding multivariate methods, 52 courses on advanced regression and generalized linear models, 44 a course on population estimation and survey design, and 19 a course on stochastic processes and time series.
CONCLUSION
The research showed that in the health professionals’ opinion there is inadequate statistics education for alumni during their 1st, master and PhD studies, and identified for graduates in the health area, some changes to courses programs which should be implemented.
LIMITATIONS
Nevertheless, we pursued the amplest vision of statistics at the workplace, we felt sincerely reserved in what the health professionals might recognize to be statistics activities and other statistical signs in the workplace. We, consequently, cannot decree the risk that we only saw a part, perhaps misleading pool of statistical practces influenced by what they considered interesting and accessible during their studies.
We believe that this study and the proposed changes have advantages and disadvantages: the lack of certainty in the validity of our understanding of each profession has been counterbalanced by the generality of the practices observed. Thus, the emerging discoveries about workplace statistics observed in one workplace could be validated in another new workplace. we believe that this approach is more likely to lead to generalization.
OPINIONS
Statistics are useful for analysis and prediction. They can show the scale of a problem, illustrate a given phenomenon, or give other useful information. The ability to focus on things when there is so much white noise. With no statistics, more mistakes would be made.
SURVEY
Thanks, in advance, for your participation in this research study. This questionnaire is part of the development of a thesis with the objective of obtaining the PhD degree in Applied Mathematics at the Faculty of Sciences of Porto. The purpose of this questionnaire is to collect and analyze the information about the Statistical techniques and methods learned in the academic course and the needs felt for the practice at work.
The results obtained will be used only for academics’ purposes (PhD thesis), being highlighted that the responses of respondents represent only their individual opinion and not the institution to which they belong.
The General Regulation on Data Protection (GRDP) regulates the protection of individuals in respect to the treatment of Personal data and the free conduct of such data, with entry into application the 25 of May of 2018.
It introduces not only new rules as high fines in case of non - compliance, which requires one attention careful of organizations that deal and have at their guard Personal Data.
Your answers will be used to better understand and, if possible, to propose adjustments to the courses so they can be adapted to real needs in work practice.
The collected data will be used only for the purpose of the thesis dissertation and are confidential. No companies will be identified or identifiable.
The estimated average time to complete the survey is less than 10 minutes.
If you want to get the results of the study, or if you have any question, do not hesitate to contact us through the mail: rosita21@gmail. com
If you want to get more detailed information on the GRDP, you can consult the following websites:
Commission European - https://ec.europa.eu/justice/smedataprotect/index_pt.htm
CNPD - https://www.cnpd.pt/
Email: _____________________________________
DEMOGRAPHIC CHARACTERIZATION
In this section we intend to collect some demographic information.
(Tick a cross (X) to the desired option)
1. What is your age?
Less than 30 years old from 30 to 40 years old
From 41 to 50 years old More than 50 years
2. What is your gender?
Masculine Feminine
3. What is your profession?
(Please tick only one of the options listed below, considering your current one)
Nursing Technician
Medicine Other
4. In case you have answered Technician or Other in the previous question, please specify.
________________________________________________________________
5. How long have you been in this profession?
(Please tick only one of the options listed below)
Up to 1 year Between 2 years and 6 years
More than 6 years
6. What are your academic qualifications?
(Check only one of the options listed below)
Bachelor’s Degree Graduation Master’s degree
Postgraduate studies PhD
THE USE OF STATISTICS
In this section we intend to realize what is your statistics training and what are your statistical needs for the practice of your professional activity.
7. In your practice, where do you think you most need statistics?
(Tick all the different options you consider using)
Data Analysis Papers Writing
Studies Design Interpretation of collected data
Read published research No need of statistics in my professional practice
8. Did your undergraduate course include any of the items below?
(Tick all the different options you consider using)
9. What are the techniques and methods that you use in your practice?
(Tick all the different options you consider using)
10. What techniques and methods do you feel the need to deepen knowledge?
(Tick all the different options you consider using)
IN ADDITION TO THE 1ST CYCLE OF STUDIES
The purpose of this section is to understand your opinion about statistics teaching in your course.
11. Do you consider that the year in which Statistics is taught in your course is the appropriate one?
Yes Not
12. If you answered no to the previous question, please explain the reason, and indicate which year you would consider appropriate.
______________________________________________________________________________________________________________________________
13. Should the development of employability and the application of education be an objective of undergraduate university degrees?
(Choose only one option )
Not directly, should focus on the central issue. Until certain point, but limited and optional.
Yes, and in a well- managed way.
14. What do you think could be the main impact of Statistics teaching? (Choose only one option )
A better understanding by students of the employer’s potential needs
Greater character development and student confidence
Improvement of student skills.
15. Please describe a situation (and strategies used) in which you made use of your Statistical Knowledge.
REFERENCES
- Ocaña-Riola R (2016) The use of statistics in health sciences: situation analysis and perspective. Statistics in Biosciences 8(2): 204-219.
- Fisher R (1955) Statistical methods and scientific induction. J Royal Statistical Society 17(1): 69-78.
- Lappan G (1999) Mathematics and the Workplace. (NCTM) National Council of Teachers of Mathematics.
- Brown J, David I, Moltchanova E, Seddon H, Harlow J (2014) Improving statistical literacy at university.
- Matthews DR, McPherson K (1987) Doctors’ ignorance of statistics. Br Med J 294(6576): 856-857.
- Wegwarth O, Gigerenzer G (2011) Statistical illiteracy in doctors. Gigerenzer EG, Gray JA (Ed.), Better doctors, better patients, better decisions: Envisioning health care. MIT Press, USA, pp. 137-151.
- Batanero C, Chernoff EJ, Engel J, Lee HS, Sánchez E (2016) Research on teaching and learning probability. Batanero EC, Chernoff EJ, Engel J, et al., (Eds.), Research on teaching and learning probability. ICME-13 Topical Surveys, Springer International Publishing, Switzerland, pp.1-33.
- Ben-Zvi, D, Garfield J (2004) Statistical literacy, reasoning and thinking: goals, definitions, and challenges. Em D. Ben-Zvi, J. Garfield (Eds.), The challenge of developing statistical literacy, reasoning, and thinking. Kluwer, USA, pp. 3-16.
- Bakker A, Gravemeijer K (2004) Learning to reason about distribution. Ben Zvi, Garfield J (Eds.), The challenge of developing statistical literacy, reasoning, and thinking, Kluwer, The Netherlands, pp. 147-168.
- Bookstaver PB, Miller AD, Felder TM, Tice DL, Norris LB, et al. (2012) Assessing pharmacy residents’ knowledge of biostatistics and research study design. Ann Pharmacother 46(7-8): 991-999.
- Beurze SM, Donders AR, Zielhuis GA, Vegt Fd, Verbeek M (2013) Statistics anxiety: A barrier for education in research methodology for medical students? Medical Science Educator 23(3): 377-384.
- Hannigan A, Hegarty AC, McGrath D (2014) Attitudes toward statistics of graduate entry medical students: the role of prior learning experiences. BMC Med Educ 14(1): 70.
- Johnson TV, Abbasi A, Schoenberg ED, Kellum R, Speake LD, et al. (2014) Numeracy among trainees: are we preparing physicians for evidencebased medicine? Journal of Surgical Education 71(2): 211-215.
- Kiekkas P, Panagiotarou A, Malja A, Tahirai D, Zykai R, et al. (2015) Nursing students’ attitudes toward statistics: Effect of a biostatistics course and association with examination performance. Nurse Educ Today 35(12): 1283-1288.
- Wu Y, Zhang L, Liu L, Zhang Y, Liu, X (2015) Attitudes of medical graduate and undergraduate students toward the learning and application of medical statistics. J Biol Educ 49(3): 220-231.
- Schau C, Millar M, Petocz P (2012) Research on attitudes towards statistics. Stat Educ Res J 11(2): 2-5.
- Harraway J (2014) Experiences with real and accessible recent data in context to motivate student learning at higher levels in statistics.
- Heaton RM, Mickelson WT (2002) The learning and teaching of statistical investigation in teaching and teacher education. Journal of Mathematics Teacher Education 5(1): 35-59.
- Moore T (2017) Health Numeracy and communicating risk to patients: medical students’ risk literacy and attitudes toward statistics. Liberty University, Virginia.
- Saraiva AC (2015) Actitudes de los estudiantes de ciencias de la salud frente a la estadística y la investigación (Tesis Doctoral). Universidad de Extremadura, Spain.
- Association AS (2018) Obtido de This is Statistics.
- Snee RD (1993) What’s missing in statistical education? The American Statistician, 47(2), 149-154.
- Quintas SM (2017) Conhecimento Didático em Estatística de Duas Professoras do Ensino Secundário a Partir das suas Práticas. Tese de Doutoramento, Tese de Doutoramento. Universidade de Lisboa, Lisboa.
- Garfield J, Ben-Zvi D (2004) The challenge of developing statistical literacy, reasoning and thinking. Springer.
- Gal I (2002) Adults’ statistical literacy: Meanings, components, responsibilities. International Statistical Review 70(1): 1-25.
- Mendonça, L, Lopes C, Soares E (2013) Educação estatística em um ambiente de modelagem matemática nas aulas do ensino médio. Horizontes, 31(1).
- Garfield J (2002) The challenge of developing statistical reasoning. J Stat Educ 10(3): 1.12.
- DelMas R (2002) Statistical literacy, reasoning and thinking: A commentary. J Statis Educ 10(3): 1-11.
- Garfield J, Gal I (1999) Teaching and assessing statistical reasoning: national council teachers of mathematics. Stiff EL (Ed.), Developing mathematical reasoning in grades K-12. National Council Teachers of Mathematics, pp. 207-219.
- Batanero C (2001) Didáctica de la estadística. Granada: Departamento de Didáctica de la Matemática.
- DelMas R (2004) A comparison on mathematical reasoning and statistical reasoning. Ben-Zvi, Garfield J (Ed.), The challenge of developing statistical literacy, reasoning and thinking. Kluwer, USA, pp. 79-95.
- Fárdales Macías VE, Diéguez Batista R, Puga García A (2012b) La dinámica de la formación estadística del profesional de medicina: fundamentos teóricos. Gaceta Médica Espirituana, 14(3): 255-259.
- Fárdales Macías VE, Diéguez Batista R, Puga García A (1 Jul de 2012a) La formacion estadistica del profesional de medicina: principales rasgos que deben caracterizar su dinamica. Pedagogia Universitaria 17(4): 80- 95.
- Demets DL, Stormo GD, Boehnke M, Louis TA, Taylor J, et al. (2006) Training of the next generation of biostatisticians: A call to action in the US. Stat Med 25(20): 3415-3429.
- Zelen M (2006) Biostatisticians, biostatistical science and the future. Stat Med 25(20): 3409-3414.
- Freeman JV, Collier S, Staniforth D, Smith KJ (2008) Innovations in curriculum design: A multi-disciplinary approach to teaching statistics to undergraduate medical students. BMC Med Educ 28(1): 28.
- Ríos Obregón JM, Fardales Macías VE (2018) La preparación estadística del profesional médico, una tarea pendiente. Gaceta Médica Espirituana 20(2): 6-11.
- Altman DG, Bland JM (1991) Improving doctors’ understanding of statistics. Journal of the Royal Statistical Society 54(2): 223-267.
- Berwick M, Fineberg V, Weinstein C (1981) When doctors meet numbers. Am J Med 71(6): 991-998.
- Caverly TJ, Prochazka AV, Combs BP, Lucas BP, Mueller SR, et al. (2015) Doctors and numbers: An assessment of the critical risk interpretation test. Med Decis Making 35(4): 512-524.
- Miles S, Price GM, Swift L, Shepstone L, Leinster SJ (2010) Statistics teaching in medical school: Opinions of practising doctors. BMC Med Educ 10(1): 75.
- Susarla SM, Redett RJ (2014) Plastic surgery residents’ attitudes and understanding of biostatistics: A Pilot study. J Surg Educ 71(4): 574-579.
- Wulff HR, Andersen B, Brandenhoff P, Guttler F (1987) What do doctors know about statistics? Stat Med 6(1): 3-10.
- Anderson BL, Gigerenzer G, Parker S, Schulkin J (2014) Statistical literacy in obstetricians and gynecologists. J Healthc Qual 36(1): 5-17.
- Narayanan R, Nugent R, Nugent K (2015) An investigation of the variety and complexity of statistical methods used in current internal medicine literature. South Med J 108(10): 629-634.
- Ghazal S, Cokely ET, Garcia-Retamero R (2014) Predicting biases in very highly educated samples: Numeracy and metacognition. Judgement and Decision Making 9(1): 15-34.
- Cardoso MF, Correia T (2009) A utilização de um modelo de blended learning no ensino da Bioestatística ao Mestrado em Saúde Pública. Conferência IADIS Ibero-Americana.
- Masel J, Humphrey PT, Blackburn B, Levine JA (2015) Evidencebased medicine as a tool for undergraduate probability and statistics education. CBE Life Sci Educ 14(4): ar42.
- Evans KH, Thompson AC, O’Brien C, Bryant M, Basaviah P, et al. (2016) An innovative blended preclinical curriculum in clinical epidemiology and biostatistics: Impact on student satisfaction and performance. Acad Med 91(5): 696-700.
- Milic NM, Trajkovic GZ, Bukumiric Z, Cirkovic A, Nikolic I, et al. (2016) Improving education in medical statistics: Implementing a blended learning model in the existing curriculum. PLOS ONE 11(2): e0148882.
- FitzSimons GE (2013) Doing mathematics in the workplace. Brief review of selected literature. Adults Learning Mathematics: An International Journal 8(1): 7-19.
- Wiesmann D, Lima IA, Ferrão P, Fernández J (2011) Residential electricity consumption in Portugal: findings from top-down and bottom-up models Energy Policy. Energy Policy 39(5): 2772–2779.
- Wackerly D, Mendenhall W, Scheaffer R (2007) Mathematical statistics with applications.
- Garfield J, Ahlgren A (1998) Difficulties in learning basic concepts in statistics: implications for research. Journal for Research in Mathematics Education 19(1): 44-63.
- Federer WT (1978) Some remarks on statistical education. The American Statistician 32(4): 117-121.
- Council NR (1991) Moving beyond myths: Revitalizing undergraduate mathematics. National Academy Press, USA.
- Campos CR, Wodewotzki ML, Jacobini OR (2011) Educação Estatística: teoria e prática em ambientes de modelagem matemática (1st edn.). Belo Horizonte: Autentica.
- Garfield J (2003) Assessing statistical reasoning. 2(1): 22-38.
- Garfield J The statistical reasoning assessment: Development and validation of a research tool. Pereira-Mendoza VL (Ed.), Proceedings of the fifth international conference on teaching statistics. International Statistical Institute, The Netherlands, pp. 781-786.
- Hogg RV (1991) Statistical education: Improvements are badly needed. Am Statistician 45: 294-299.
- Zellner A, Huang DS (1962) Further properties of efficient estimators for seemingly unrelated regression equations. International Economic Review 3(3): 300-313.
- Chong H (2012) Building vintage and electricity use: old homes use less electricity in hot weather. European Economic Review 56(5): 906-930.
- Garfield J, Ben-Zvi D (2007) How students learn statistics revisited: A current review of research on teaching and learning statistics. International Statistical Review 75(3): 372-396.
- Ben-Zvi D, Garfield J (2010) Introducing the emerging discipline of statistics education. School Science and Mathematics 108(8): 355-361.
Article Type
Research Article
Publication history
Received date: September 18, 2021
Published date: October 14, 2021
Address for correspondence
Rosa Santos Oliveira, Departamento de Informática e Matemática, Escola Superior de Administração e Comércio, Instituto Politécnico de Bragança, Portugal
Copyright
©2021 Open Access Journal of Biomedical Science, All rights reserved. No part of this content may be reproduced or transmitted in any form or by any means as per the standard guidelines of fair use. Open Access Journal of Biomedical Science is licensed under a Creative Commons Attribution 4.0 International License
How to cite this article
Rosa SO. Statistics in Health... Is There a Connection Between School and Workplace Statistics?. 2021- 3(5) OAJBS.ID.000334.