Seroprevalence of HBV/HCV-HIV Co-infections and Outcome After 24 months of HAART in HIV Patients, in Kumba Health District, Southwest Region of Cameroon
ABSTRACT
Viral hepatitis is a public health problem. Co-infection of HIV patients with HBV or HCV is associated with increased risk of liver
diseases and hepatotoxicity associated to antiretroviral therapy. This study aims to determine the burden of hepatitis B or C in HIV
patients, to monitore the effect of hepatitis B and C on HIV patients placed on highly activtive antiretroviral therapy (HAART) and to
identify the associated risk factors for co-infections in Kumba Health, in the Southwest Region of Cameroon.
Method: We screened 299 HIV patients enrolled at four hospitals (treatment centers), in Kumba Health District for hepatitis B
surface antigen (HBsAg) and Hepatitis C antibodies (HCVAb) and confirmed by ELISA test in November 2018. Results were analyzed
using SPSS version 20 to determin the prevalence, the effect of hepatitis B and C in HIV patients and the possible risk factors. Cohort
participants were selected on relevant clinical criteria (free of tuberculosis, not on obtion B+, maximum stage III of HIV infection
and not on treatment >1 year). A total of 52 HIV patients, 36 HIV/HBV and 12 HIV/HCV patients out of the 299 were involved in the
prospective cohort study for 24 months follow up from the 15 November 2018 to 15 November 2020.
Result: Out of the 299 HIV patients, 36 (12.0%) were positive for HBV and 12 (4%) for HCV by both rapid diagnostic test
(RDT) and Enzyme Linked Immuno-Sorbent Assay (ELISA). The majority of the participants were Single/Cohabiting/Separated 160
(53.5%), Christians 282 (94.3%), Famers 100 (33.4%), from rural areas 202 (67.6%), and those who have never received blood
from someone 267 (89.3%). There were differences in response to HAART after 24months between the mono-infected and coinfected
patients, taking into consideration the, CD4 cell counts (HIV: 930.846 cells/mm3, HIV/HBV: 595.139 cells/mm3 and HIV/
HCV: 678.500cells/mm3), and viral load (HIV: 1777.85copies/ml, HIV/HBV: 2232.61copies/ml and HIV/HCV: 750.83copies/ml).
There were variations in biomarkers of liver and renal function for both patients.
Conclusion: HIV disease following HAART do not appear to be adversely affected by HBV or HCV co-infection after 24 months,
but there are differences in response to HAART between mono/co-infected patients, with respect to CD4 count, and viral.
KEYWORDS
HIV; Hepatitis B and C; Co-infection; Prevalence; Risk Factors; Immune response; Highly active antiretroviral; Kumba health district
ABBREVIATIONS
HAART: Highly Activtive Antiretroviral Therapy; HBsAg: Hepatitis B surface Antigen; HCAb: Hepatitis C antibodies; HIV : Human Immuodeficiency Virus ; RTD: Rapid Diagnostic Test; ELISA: Enzyme Linked Immuno-Sorbent Assay ; KHD: Kumba Health District
INTRODUCTION
Viral hepatitis has emerged as an important public health problem globally, characterized by high prevalence, a high burden of morbidity and mortality, and suboptimal diagnosis and management approaches [1,2]. Hepatitis B (HBV) and C (HCV) are two among the numerous forms of infections whose clinical degeneration, morbidity-mortality and low immune responsiveness in people living with human immuodeficiency virus (HIV) are highly evident. Co-infection of HIV patients with HBV or HCV has been associated with increased risk of progression to liver diseases and risk of hepatotoxicity associated to antiretroviral therapy [3,4]. While varying in their transmission efficiency, HIV, hepatitis B (HBV), and C (HCV) share common routes of transmission, and as such, the prevalence is generally higher in HIV-infected individuals [5,6]. Studies have shown that HBV, HCV and HIV are endemic in Africa and especially the subsaharan Africa [7]. However, co-infection rates among HIV-infected individuals remain controversial [8].
Some scientists have reported that the worldwide prevalence of HBV ranges from 1.13-59% [9]. Hepatitis B virus is detected in blood and body fluids (semens, saliva, and nasopharyngeal fluids), and the four major modes of transmission are: sexual contact, mother to child transmission in pregnancy and at birth, blood to blood contact and through sharing of infected items [10]. The world’s predominant mode of transmissiom of HBV is perinatal. In this case, children born of HBV positive mother have 90% chance of having the infection too among whom 25% will die in adult life of chronic liver disease or cancer [11].
Sub-Saharan Africa [SSA] has the highest burden of infectious diseases and remains the epicenter of global HIV epidemic [12,13]. In one meta-analysis, HIV/HBV frequency in SSA varied from 0 to 28.4% (median 7.8%) [1]. Study carried out in South African among HIV patients receiving ARV therapy showed a prevalence of 5% for HBsAg [14]. Also, a prospective study carried out among HIV patients admitted to a large government hospital in Johannesburg found a co-infection rate of 6% [15]. Further, retrospective control laboratory-based study showed HBV rate of 16.2% among the HIV patients from a more rural area of the country [16]. A study carried out in HIV patients in Mfou community in Cameroon showed a Prevance of HBsAg of 8.9% [17]. It is worth noting that this study did not present information about demographic risk factors, stage of HIV infection and viral load. Also, a study carried out in the Northwest Region of Cameroon presented a prevalence of hepatitis B virus of 12.6% among HIV patients [18], while that carried out among people of age 18 years and above in Fako Division in the Southwest region of Cameroon showed a prevalence of HBV among HIV patients to be 1.18% [19].
Hepatitis C Virus is also detected in blood and body fluids and transmitted from an infected person to a non infected person in like manner as for HBV. HIV /HCV co-infection is being recognized as a separate entity from HIV or HCV mono-infections [20]. The prevalence of HCV among the HIV patients taking antiretroviral therapy according to a cohort study carried out in Switzerland is 37.2% [21]. Two systematic reviews suggest an overall HCV prevalence of 3% among people living with HIV in SSA with significant regional variations [0-55.9%]; [3,22].
Recent study of HBV and HCV co-infections among HIV patients age 21years and above at the Buea and Limbe regional hospitals showed respective prevalence of 6.1% and 2.8% [23]. With increasing access to ARV therapy and increasing HBV and HCV infections, the burden of the latter among the HIV patients in resource limited countries is expected to increase at all ages contrary to the case in Europe and North America [24]. Understanding the prevalence and disease characteristics of HBV and HCV amongst the HIV patients is thus very essential [25,26].
National Guideline for clinical management of HIV patients recommends screening for viral hepatitis; unfortunately, this is not standard practice in Cameroon, as it is not included in the package of baseline laboratory tests [23]. Giving the lack of epidemiological data from the Kumba Health District data base, there is a need for District representative estimates to ascertain the scope of viral hepatitis burden among HIV-positive individuals in Kumba Health District which will help give information for future health policy and decision making in Cameroon. Also, considering the fact that HIV infection alone stressed the liver cells couple to it premodial role in the metabolism of anti-retroviral drugs, further infections of HIV patients with hepatitis B or C will lead to further liver damage and hence destruction of the CD4 cells due to the multiplication of the HIV. Following the above mentioned, it was thus a question for us to know the prevalence and the effect of hepatitis B or C among HIV patients in Kumba Health District, which will help improment in the management of co-infected patients in Cameroon. We therefore hypothesized in the present study that the infection of HAART treaded HIV patients by hepatitis B or C in Kumba Health District (KHD), leads to the deteration of the immune response in these patients. In order to ascertain this, we proposed the following objectives:
MATERIAL AND METHODS
Location of Study Areas
This study was carried out in the Kumba Health District in Meme Division in the Southwest region of Cameroon. The health facilities concerned were the Kumba District hospital, CMA Kumba Town hospital, and the Apostolic hospital Banga-Bakundu (Figure: 1).
Sample Size Determination
The sample size for this study was calculated using a prevalence of 6.1% [23] at 99% confident level, precision of 5%, design effect of 1.5, non-compliance effect of 30%, and a total of 6743 HIV infected patients on treatment in Kumba Health District, as follow:
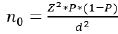 n0 = sample size, Z = the selected critical value
of desired confidence level (2.58 for 99% confidence level), P =
prevalence (6.1%), d = Precision (5%).
n0 = sample size, Z = the selected critical value
of desired confidence level (2.58 for 99% confidence level), P =
prevalence (6.1%), d = Precision (5%).
Hence, 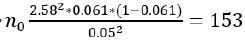 participants
A design effect of 1.5 was accounted as follow,
n0=1.5*153 = 230
Adjusting for a non-compliance effect of 30% implies, 0.3*230 = 69
Therefore, n0= 69+230= 299 participants.
Since the study population is finite (6743 HIV patients on treatment in Kumba Health District), the formula below was also used.
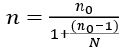
n = final (corrected) sample size, N = total number of HIV positive clients on treatment in Kumba Health District.
However, because the proportion of  did not exceed 5%
  =4.4%, n0 = n
Hence, 299 participants were screened for HBV/HCV.
Sampling Methods
In this study, we selected Kumba health District as the study area due to it high risk nature for transmission. In the Kumba health District, there were five HIV treatment centers: District hospital Kumba, Centre Medical d’Arrondissement (CMA) Kumba, Presbyterian hospital Kumba, Baptist health center Kumba and Apostolic hospital Kumba. The HIV treatment centers were numbered from 1 to 5 on pieces of papers, placed in a bowl, shuffled and three drawn out at random (randon samplings). The three treatment centers selected were District hospital Kumba, CMA Kumba, and Apostolic hospital Kumba, with a total of 4343, 561, and 8 HIV patients on treatment respectively. The number of HIV patients selected for this study from each treatment center was based on the total number of HIV patients on treatment in that center as follow
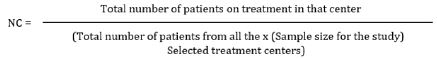
Where Nc = Numbered of patients sampled per treatment center.
Therefore, the number of patients sampled in the district hospital Kumba and Centre Medical d’Arrondissement (CMA) Kumba were 264 and 34 respectively. However, the above formula could not be applied for Apostolic hospital Kumba since there was just 8 HIV patients on treatment there; all the 8 patients from Apostolic hospital Kumba were included in this study, but 7 patients were subtracted from the 264 for the district hospital Kumba to give 257, such that the sum of the three, 257, 34 and 8 gives study sample size of 299. Systematic random sampling was used in each treatment center to select patient’s files that were included in the study, except for Apostolic hospital Kumba where all the patients were included. Patient’s files were arranged on shelves in their respective cohorts of months and years. In both the District hospital Kumba and Centre Medical d’Arrondissement (CMA), Kumba patients’ files were selected after every 16th file; A sampling fraction of 1/16th .
Study Subjects And Test Sample
This study included both males and females infected with HIV taking antiretroviral therapy in Kumba Health District, after securing their consent to participate in the study at the selected study sites. Blood samples were then collected from the consented participants for the determination of the prevalence. The prospective cohort part of the study included those tested positive for HBV and HCV, and HIV patients who were free of tuberculosis, at most at stage III of HIV infection, not on option B+, not on HAART for more than one year.
Inclusion criteria for the determination of the prevalence of HBV and HCV in HIV patients: The following inclusion criteria were used for the selection of the participants for the determination of the prevalence of hepatitis B and C among HIV patients:
a). All the HIV patients taking HAART at the selected treatment
centers,
b). All Participants who gave their concernt,
c). All patient’s resident in Kumba Health District and
d). Patients of all ages and both sexes.
Inclusion criteria for the 24 months follow-up: The following inclusion criteria were used for the selection of the participants for the 24 months follow up:
a). Free of tuberculosis,
b). Be at most one year on HAART,
c). Be at most at stage III of HIV infection, and
d). Not on option B+,
e). Healthy lifestyles conditions (non addiction to alcohol).
Study Design
This study was prospective cohort study in which data-samples were collected through the registers, administration of data collection form to the participants and sample analysis. The HIV patients were selected for this study through a systematic random sampling technique. All the HBV and HCV positive HIV patients gotten during screening for sero-positivity were involved in the follow up study together with some HIV patients that were selected through a systematic sampling technique following the selection criteria.
Ethical Considerations
Ethical clearance was obtained on the 15th November 2018 and 27 September 2019, from the Institutional Review Board of the Faculty of Health Science, University of Buea following the protocol Reference no: 2018/814-05/UB/SG/IRB/FHS and 2019/814- 05/UB/SG/IRB/FHS respectively. Administrative clearance was obtained from the Regional Delegation of Public Health for Southwest Region Cameroon and written approval from the head of every hospital under study. Participants had the study protocol carefully explained to them and participation was voluntary. Written informed consent was obtained from all participants. Study participants, data confidentiality and integrity were maintained by restricting access of the information and primary data to the principal investigator.
Data Collection
Data were collected in two sections, firstly for the determination of the prevalence of hepatitis B and C in HIV patients and secondly for follow up response to HAART.
Data collection for determination of prevalence: Data were collected from the participants after having administered an informed consent. The data collection form was composed of demographic and factual questions. Demographic questions were based on information such as sex, age and occupation, likewise factual questions were based on obtaining information from the participants through clinical observation and interrogation of the participant.Concerning Hepatitis B and/or C, we collected data from participants based on clinical observation of some skin changes such as stomach pain, tiredness (fatigue), fever, loss of appetite, nausea and vomiting, Discomfort on the right side of the abdomen under the rib cage, dark urine, yellow discoloration of the skin and eye etc. We equally interrogated the participants on their knowledge on the two infections. This study targeted HIV-positive patients enrolled at the district hospital Kumba, Centre Medical d’Arrondissement Kumba and Apostolic hospital Banga-Bakundu, who were selected for this study. Screening was offered free-ofcharge to all selected consented participants. The participants were followed up monthly at the health facilities and as such, all eligible individuals had the opportunity to undergo screening during the implementation period. Samples were collected and analyzed six monthly from all the participants eligible for the cohort part of the study. All the participants screened including all their demographic information, disease characteristics, and HBV and HCV clinical test results, and other results from cohort part were entered in a data capturing sheet.
Data collection for follow up of response to HAART: This study was carried out from the 15th November 2018 to the 27th September 2020. Data were collected from the 52 HIV, 36 (HIV/ HBV) and 12 (HIV/HCV) studied participants after sample analysis. Data for this study were obtained from the analysis of samples of the participants for CD4 counts, ALAT/ASAT, albumin and bilirubin six monthly and six monthly for viral load test. We equally recorded the weights of the participants six monthly. Sample analysis was offered free-of-charge to all the 100 participants. All the participant’s results obtained after the analysis of samples including their entire weights were entered in a data capturing sheet. The summary procedures of the study were as follow: Selected participants were invited for clinical examination during routine HIV appointments, during which samples were collected and analyzed in the laboratories at the study sites. Sample analysis was performed using PIMA analyzer for CD3+/CD4+ Cell Count, Cypress diagnostics, Lot: GOT-00371A, Ref: HBEL010 for the measurement of Serum aspartate amino-transferase, (AST), Cypress diagnostics, Lot: GPT-00371A, Ref: HBEL020 for the measurement of alanine amino transferase, (ALT), Rand and Pasqua, 1982 for the measurement of total and direct bilirubins, spectophotometer for albumine and creatinine. All samples for viral load test were transported according to a prescribed procedure to the Baptist hospital in Mutengene where Abott Real Time (m2000sp) assay was performed aimed at quantifying HIV-1 RNA with the reportable range of 40 to 10,000,000 HIV-1 RNA copies per ml (Figure 2).
Transportation of Sample for Viral Load Analysis
Serum samples collected were stored in a refrigerator between 2 to 8°C. The temperature was recorded daily by the aid of a fridge tag. The samples were then transported from the various study sites to the Baptist Hospital Mutengene for the viral load analysis. The samples were transported according to the transportation only with the different that the transportation here was done through a system of courier in which the person transporting signed a consignment note and left a copy as proof of collection (transportation was done following the usual health facilities model). The samples transported for viral load were analyzed by Abott Real Time (m2000sp) assay, which is aimed at quantifying HIV-1 RNA with the reportable range of 40 to 10,000,000 HIV-1 RNA copies per ml. Left over samples after use was discarded in the various health facilities following the procedures put in place.
Treatment Outcomes of Hiv/Hbv and Hiv/Hcv Co- Infected Patients Following HAART (Tenofovir Lamivudine Efeverenz)
The three endpoints used to test the clinical, virological, and immunological response of co-infected and mono-infected patients to HAART were time to weight, detectable viral load and to CD4 cell counts after every six months for 24 months. For the analyses, only. The patients were grouped by no hepatitis infection, infection with HBV only and HCV only. Baseline was defined as the date when all the above-mentioned parameters including the parameters for liver and renal function tests were analyzed. The effect of hepatitis co-infection on viraemia at 24 months after baseline was assessed by logistic regression among patients with baseline viral load measurement. The effect of hepatitis coinfection on immunological manifestation was assessed by fitting a linear model on time‐weighted average changes in CD4 counts from baseline to 24 months. Concerning liver toxicity, ALAT/ASAT, albumin, and bilirubin were also evaluated likewise renal functions were assessed through creatinine levels. In addition to having received HAART, patients were required to have been on HAART for almost one year and should be almost at stage III of HIV infection. Co-variates tested for inclusion in all multivariate models were HIV positive category, HIV stage of almost III, be on HAART for not more than one year, be free of TB, not pregnant and should be on regular therapy in the study sites. Each covariate was tested at the 5% level using the chi‐squared test for heterogeneity if it was a nominal variable or a t‐test for trend if it was ordinal.
Data Management and Analysis
Data was entered into Microsoft Excel and analyzed using the statistical software SPSS version 20. The different variables included demographic information like: Age, sex, marital status, duration of association, level of education, religion, occupation, civil status, and for actual information like: WHO staging, therapy, smoking status, alcohol status, living with hepatitis B or C infected persons, blood transfusion history, hepatitis status and regular taking of ART. Also, the other variables included the outcome variables like: CD4, weight, viral load, full blood count, ALAT, ASAT, albumin, bilirubin and creatinine and the independent variables like: HBV and HCV. Descriptive statistics were performed for all variables and the district prevalence of HBV and HCV were calculated with the corresponding 95% confidence intervals. The prevalence of HBV and HCV by demographic and other key variables was determined using the chi square test. P values less than 0.05 were statistically significant. Multivariate binary logistic regression was used to determine the risk factors associated with HBV and HCV prevalence and treatment outcome.
To evaluate the knowledge of participants on the modes of transmission and cardinal signs/symptoms of HBV/HCV, participants were required to provide “yes”/ “no” responses. The knowledge questions were identified and transferred into Microsoft excel. Each correct response on knowledge was assigned a score of one and an incorrect response was assigned a score of zero. The sum of scores was transferred to SPSS where a composite score was calculated, and informants ranked into two categories using the mean value: good level of knowledge for those who scored above the mean, and poor knowledge for those who scored below the mean. The overall knowledge scores were calculated using descriptive statistics.
RESULTS
Sociodemographic Charactaristics of the Study Participants
A total of 299 HIV positive patients were screened for HBV and HCV in three treatment centers of the Kumba Heath District. Majority of the study participants were from the district hospital Kumba 257 (86.0%), female 208 (69.6%), aged 35 to 44 (33.1%), and with primary level of education 126 (42.1%). In addition, majority of the study participants were Single/Cohabiting/Separated 160 (53.5%), Christians 282 (94.3%), Famers 100 (33.4%), from rural areas 202 (67.6%) and have not ever received blood from someone 267 (89.3%). (Table 1). Knowledge of Participants on the Modes of Transmission and Cardinal Signs/Symptoms of HBV/HCV.
The knowledge of participants on the modes of transmission and the signs/symptoms of HBV/HCV are presented in the figures. Overall, 26.8% (0.86. ± 1.64: mean±standard deviation) and 26.4% (0.70±1.36: mean±standard deviation) of the participants recorded good level of knowledge on the modes of transmission and the cardinal signs/symptoms of HBV and HCV respectively. As per the modes of transmission of HBV/HCV very limited number of the participants, 28 (9.4%) reported to have known the modes of transmission of HBV/HCV and specifically through blood 28 (100.0%). Pertaining to the signs/symptoms of HBV/HCV a small proportion of the participants reported that stomach pain is a sign/ symptom of HBV, 50 (16.7%) and HCV, 47 (15.7%) respectively. In addition, a very small proportion of the study participants reported that dark urine is a sign/symptom of HBV, 1 (0.3%) and HCV, 2 (0.7%) respectively. Furthermore, a very small proportion of the study participants also reported that yellow skin appearance is a sign/symptom of HBV, 1 (0.3%) and HCV, 2 (0.7%) respectively (Table 2); (Figure 3).
Prevalence of HBV/HCV
Out of the 299 HIV positive patients screened for HBV and HCV, 36 (12.0%) (95% CI: 1.96-2.03) were positive for HBV and 12 (4%) (95% CI: 1.97-2.02) for HCV by both RDT and ELISA (Figures 4,5).
Prevalence of HBV and HCV by Socio-Demographic Characteristics and Other Associative Factors
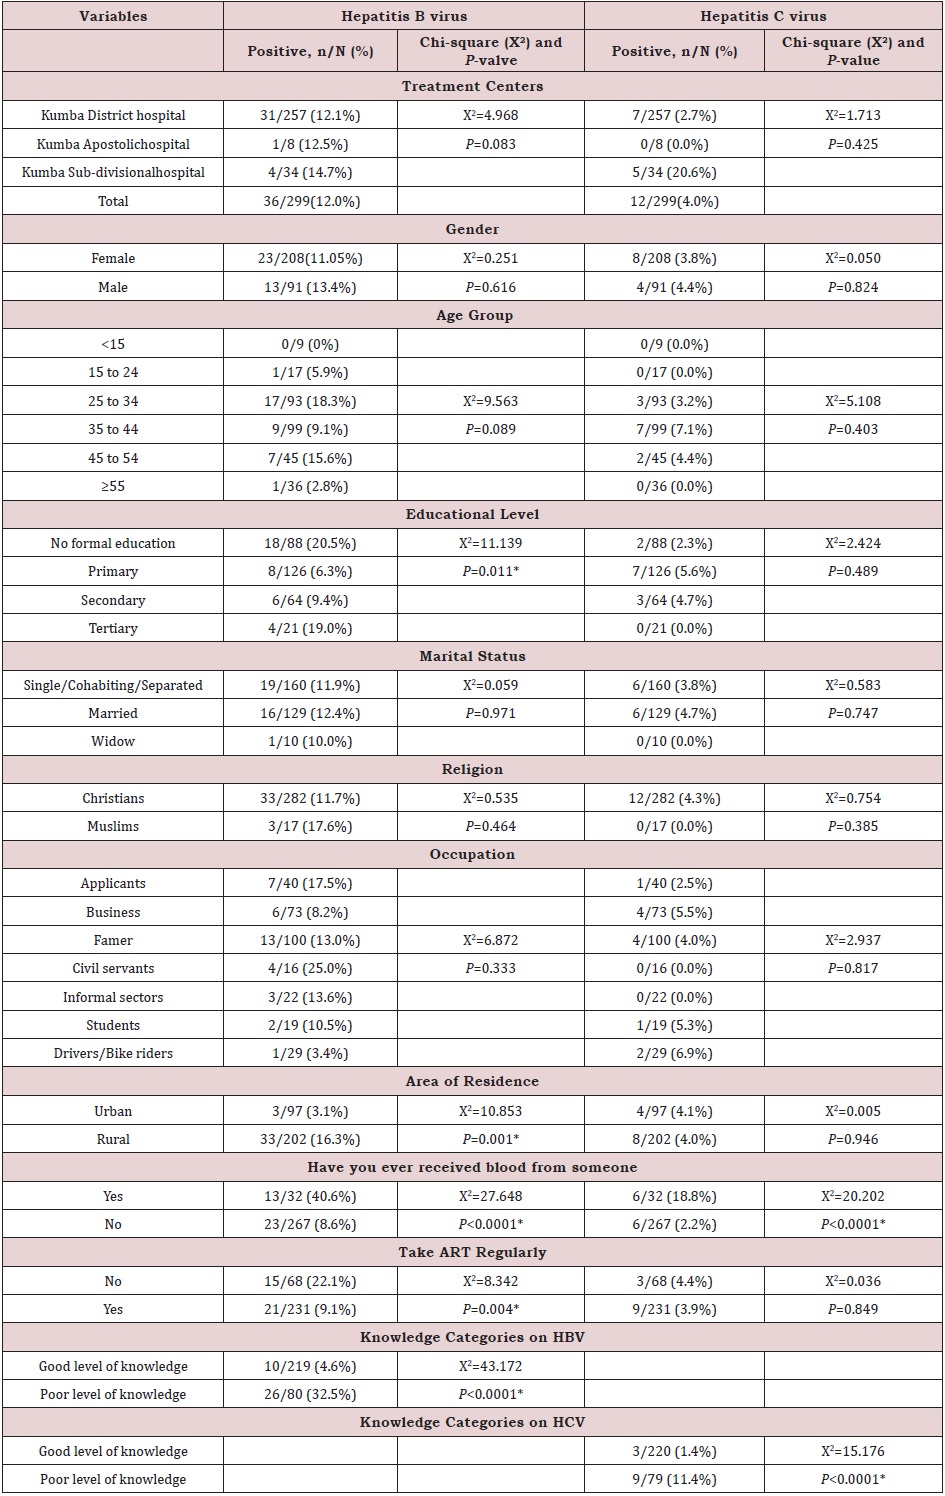
The prevalence of hepatitis virus was also displayed in terms of demographic and other associative factors like blood transfusion, area of resident etc. The prevalence of hepatitis C virus was significantly higher in participants from Kumba Subdivisional hospital (4/11.8%), X=6.178, p =046). In addition, the prevalence of hepatitis B virus was higher in participants with no formal education (18/88 (20.5%), X2=11.139, P=0.011). Also, the prevalence of hepatitis B virus was significantly higher in participants who live in rural areas, 33/202 (16.3%) compared to those who live in urban areas, 3/97 (3.1%) (X2=10.853 P=0.001). Looking at the sexes, both the prevalence of hepatitis B and C virus were significantly higher in males than female i.e for HBV, females 23/208 (11.05%) (X2=0.251, P=0.616) and males 13/91 (13.4%) (X2=0.251, P=0.616) and for HCV, females 8/208 (3.8%) (X2=0.050, P=0.824) and males 4/91 (4.4%) (X2=0.050, P=0.824).
As pertaining to blood transfusion, the prevalence of both hepatitis B (13/32 (40.6%), X2=27.648, P<0.0001) and hepatitis C (6/32 (18.8%), X2=20.202, P<0.0001) virus was significantly higher in participants who reported that they have received blood from someone. Furthermore, participants who reported that they do take their ART regularly significantly had a low prevalence of hepatitis B, 21/231 (9.1%) compared to those who do not take their ART regularly 15/68 (22.1%) (X2=8.342, P=0.004). As regarding to the level of participant’s knowledge on the modes of transmission and the cardinal signs/symptoms of hepatitis viruses, participants who recorded poor level of knowledge on hepatitis B virus significantly had a high prevalence of hepatitis B virus, (26/80 (32.5%) compared to those who recorded good level of knowledge on hepatitis B virus, 10/219 (4.6%) which was statistically significance (X2=43.172, P<0.0001). In addition, participants who recorded poor level of knowledge on hepatitis C virus significantly had a high prevalence of hepatitis C virus, 9/79 (11.4%), compared to those who recorded good level of knowledge on hepatitis C virus, 3/220 (1.4%) (X2=15.176, P<0.0001) (Table 3).
Risk Factors of Hepatitis B and Hepatitis C Viruses
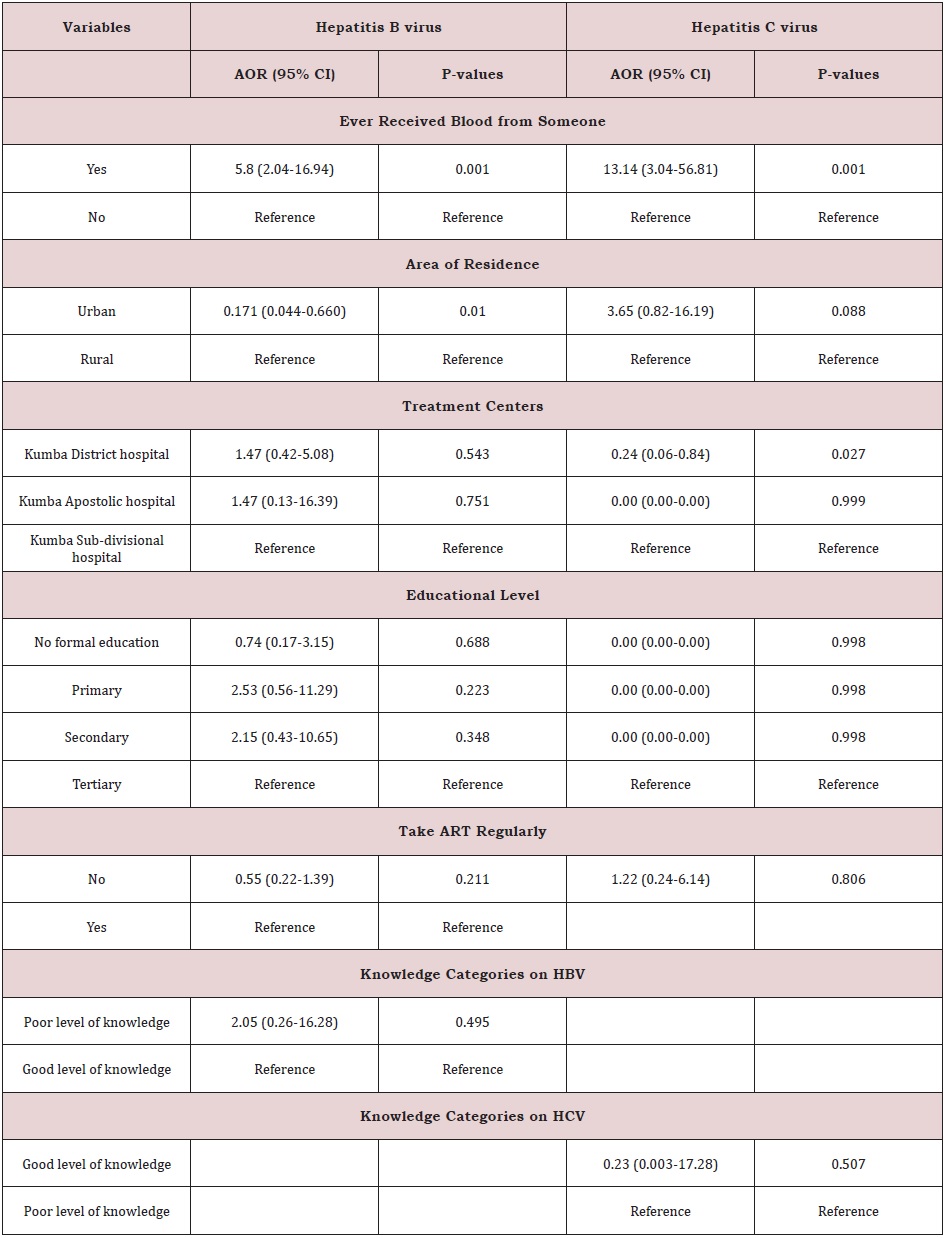
After conducting a bivariate analysis using chi-square, the following variables were entered into a multivariate binary logistic regression model to control for the effects of other explanatory variables: Area of residence, history of blood transfusion, educational level, take ART regularly, level of knowledge categories on HCV, level of knowledge categories on HBV. Participants that have ever received blood from someone were 5.88 times more likely to be infected with hepatitis B (95% CI: 2.04-16.94, P-values: 0.001), and 13.14 times more likely to be infected with hepatitis C (95% CI: 3.04-56.81, P-values: 0.001), than participants who have never received blood from someone (Table 4). Participant’s area of residence also had a significant effect on hepatitis B virus prevalence. The odds are low for participants from Urban areas (0.171 times that of those from Rural areas). Therefore, participants from Rural areas are 5.84 (1/0.171) times more likely to be infected with hepatitis B than those from Urban areas (95% CI: 0.044-0.660, P-values: 0.010); (Table 5). Also, both the prevalence of hepatitis B and C virus were significantly higher in males than female i.e for HBV, females 23/208 (11.05%) (X2=0.251, P=0.616) and males 13/91 (13.4%) (X2=0.251, P=0.616) and for HCV, females 8/208 (3.8%) (X2=0.050, P=0.824) and males 4/91 (4.4%) (X2=0.050, P=0.824).
Furthermore, centers had a significant effect on hepatitis C virus prevalence. The odds are low for participants from Kumba District hospital (0.24 times that of those from KumbaSubdivisional hospital). Thus, participants from Kumba Subdivisional hospital 4.14 (1/0.24) times more likely to be infected with hepatitis C virus than those from Kumba District hospital (95% CI: 0.06-0.84, P-values: 0.027) (Table 6).
Effect of HBV/HCV on Response to HAART in HIV Patients During 24 Months of Evaluation
Response to treatment of HIV patients co-infectedwith HBV and HCV: The following parameters were used to monitor response to treatment of HIV patients and HIV patients co-infected with HBV and HCV, weight, viral load and CD4. The below presents the mean immune response measurements between 1 and 24 months in co-infected and mono-infected patients and it can be seen that whether mono-infected or co-infected, there was a significant change from baseline for all the variables used to measure immune response. Except an increased body weight during the first six, months for HIV. HIV/HBV and HIV/HCV patients; there was not significant change for this parameter during subsequent months. While CD4 count for HIV was greater than those of HIV/HBV and HIV/HCV patients. There was no significant change (P˃0.05) during the first year, for all the patients. During the second year, CD4 count gradually increased for all patients.
Regarding the viral load, there was no significant change from month 1 to 6 for all the study groups; mean while there was a continuous decreased from month 6 to 24. From table 6, it can also be observed that the co-infection of HIV patients with either HBV or HCV leads to a significant increase (P˂0.05), in viral load comparatively to mono-infected HIV patients (Table 5).
Except an increased body weight during the first six months for HIV, HIV/HBV and HIV/HCV patients; there was no significant change for this parameter during subsequent months (Figure 6). CD4 for HIV was > HIV/HBV and HIV/HCV patients but there was no significant change (P˃0.05) during the first year for both patients while CD4 count gradually increased for both patients during the second year. There was thus a rapid response to HAART in monoinfected than co-infected (Figure 7).
For viral load, there was no significant change from month 1 to 6 for both patients; but with a continuous decreased from month 6 to 24. Following statistical analysis, it was observed that co-infection of HIV patients with either HBV or HCV leads to a significant increase (P˂0.05), in viral load comparatively to mono-infected HIV patients. Differences in adherence to treatment and other factors such as alcoholic status, HIV stage at initiation (Figure 8).
Liver function for HIV and HIV/HBV and HIV/HCV coinfections: The table VIII below presents the mean liver function measurements between 1 and 24 months in HIV/HBV and HIV/ HCV co-infected and HIV mono-infected patients. Whether monoinfected or co-infected, therewas a significant decrease of ALAT and ASAT over the time from baseline to 24 months. The co-infection whether for HBV or HCV leads to significant increase (P˂0.05) of transaminases all over the follow up period compared to mono-infected patients. The co-infection of HIV patients with HBV and HCV leads to an increase of albumin and total bilirubin levels in the blood. There was a noticeable decrease in albumin level in both mono and co-infected patients from month 12 to month 24. All over the follow up period, the total bilirubin blood level gradually decreases both for HIV/HBV and HIV/HCV co-infected patients while for HIV mono-infected patients, it starts decreasing from month 6 till month 24 (Table 6).
There was an increased level of these enzymes in co-infected than mono-infected patients due to the target sites of the hepatitis which alter the functioning of the liver. Decreased in transaminase level could be due to proper follow up and adherence to treatment. Variations of these parameters were within the normal range for mono infected (Figure 9,10). This variation could indicate a well functioning of liver cells that might be referred to the effect of either immune response to viral infections or the effect of HAART. In addition, Lamivudine use in the treatment of HIV may have an effect on HBV and therefore prevent the infection from being established as scientists have demonstrated this molecule to have effect on HBV (Figure 11,12).
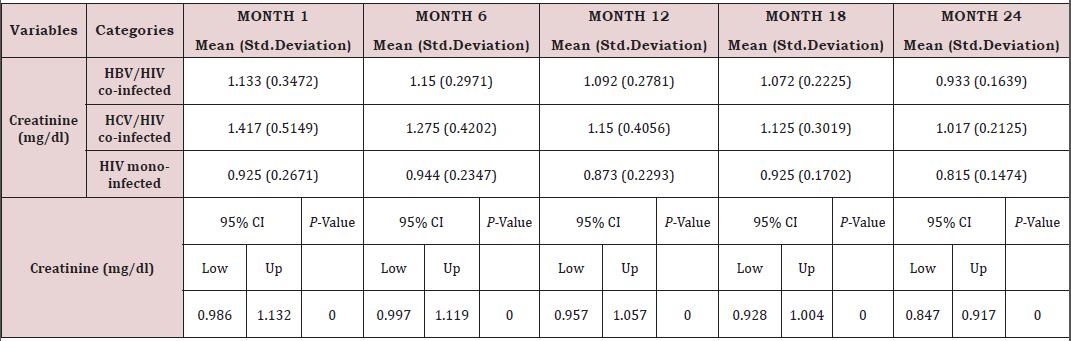
Renal function of co-infected HIV/HBV, HIV/HCV and mono-infected HIV patients: Table 7 presents mean creatinine measurements between 1 and 24 months in HIV/HBV and HIV/ HCV co-infected and mono-infected HIV patients. Regarding the creatinine, the co-infection of HIV patients either with HBV or HCV leads to a significant increase (P˂0.05) of this parameter. There was a general decrease in creatinine level in both mono and co-infected patients from month 6 to month 24 (HIV/HBV and HIV/HCV) while there was a total decrease for HIV/HCV from month 1 to month 24 (Table 6). Variation in the different graphs above could be due to differences in response to HAART between the mono-infected and co-infected patients linked to respect of treatment protocol. (Figure 13).
DISCUSSION
The national guideline for clinical management of HIV patients recommends screening for viral hepatitis, unfortunately this is not standard practice in Cameroon, as it is not included in the package of baseline laboratory tests [10]. Given the limited resources available for population screening efforts, and regular control for some key elements (viral load, CD4 count, ASAT, ALAT, albumin, bilirubin, creatinine), the present study was aimed to establish the prevalence of hepatitis B and C virus, evaluate the treatment outcomes of HIV patients and those co-infected with hepatitis B or C. We further sought to identify associated risk factors linked to the treatment outcome among these HIV-1 infected patients placed on HAART, which would contribute toward the understanding of the burden of the viral hepatitis co-infections and at-risk populations in Kumba Health District in Cameroon.
Demographic Characteristics
A total of 299 HIV patients taking ART in three different treatment centers in Kumba Health District were interviewed. The differences in the recruitment rate at the various selected treatment centers respected the patient’s population sizes. The highest number of participants was recruited from the Kumba District hospital because of the high HIV patient’s population density of the health facility. A total of 208 (69.6%) females and 91 (30.4%) males were involved in the research with a significant different. This different may be because females visited health facilities more frequently than men. Concerning the educational level of the participants, most of them had very low level of education since 42.1% had attended only primary level. Among the participants, majority came from the rural area (67.6%). Also, most of these participants were cohabiting/single/separated (53.5%). On the perspective of the occupation, a variety of occupations were presented among the participants. They were distributed as follows: 40 applicants, 73 businessmen and women, 100 farmers, 16 civil servants, 22 workers of informal sectors, 19 students/ pupils and 29 drivers/bikers. The predominance of farmers was remarkable because most of the participants were from the rural areas highly involved in farming.
Knowledge on Hepatitis B and C Virus
Only 9.4% of the participants knew the signs and symptoms of hepatitis B and C leaving 90.6% who did not know any signs and symptoms of these infections. This proportion was not good because it means that the participants had a very poor knowledge of these health threats, which means that the infections may continue to spread among the people in the community and may lead to poor management. On the other hand, only 9.4% of the participants knew that hepatitis B and C are transmitted through contact with infected blood meanwhile 90.6% did not know the cause of these infections. For the majority of the participants not knowing the cause of these infection could be attributed to the high level of very low level of education and illiteracy discovered among this people since 42.1% has attended only primary level of education while 29.4% had never attended school. In addition, the poor knowledge among the participants could also be linked to improper counseling during follow up for HIV therapy as well as implementation of social groups among HIV patients which limit regular contact between the care giver and the clients.
Prevalence of Hepatitis B Virus
The prevalence of HBV was 12% which was higher than that obtained in South African HIV patients receiving ARV therapy 5% [14], Buea and Limbe regional hospitals in HIV patients of age 21years and above 6.1% [23] and National hospital of Tropical Disease in Vietnam 8.4% [27]. On the other hand, this prevalence was slightly lower than that documented from a retrospective control laboratory-based study carried out in South Africa among the HIV patients from a more rural area of the country 16.2% [16]. In similar manner, this prevalence was slightly similar to that obtained in Australia 13.1% [28] and in the Northwest Region of Cameroon 12.6% [18].
The prevalence of hepatitis B virus was higher in participants with no formal education (18/88 (20.5%), X2=11.139, P=0.011). This prevalence was also significantly higher in participants who live in rural areas, 33/202 (16.3%) compared to those who live in urban areas, 3/97 (3.1%) (X2=10.853 P=0.001) and this was contrary with a study conducted in Rwanda in 2017. As pertaining to blood transfusion, the prevalence of hepatitis B virus (13/32 (40.6%), X2=27.648, P<0.0001) was significantly higher in participants who reported to have been transfused blood. Furthermore, participants who reported that they do take their ART regularly significantly had a low prevalence of hepatitis B, 21/231 (9.1%) compared to those who do not take their ART regularly 15/68 (22.1%) (X2=8.342, P=0.004). Lamivudine use in thetreatment of HIV may have an effect on HBV and therefore prevent the infection from being established as scientists have demonstrated this molecule have effect on HVB [29]. Regarding to the level of participant’s knowledge on the modes of transmission and the cardinal signs/ symptoms of hepatitis viruses, participants who recorded poor level of knowledge on hepatitis B virus significantly had a high prevalence of hepatitis B virus, (26/80 (32.5%) compared to those who recorded good level of knowledge about the infection, 10/219 (4.6%) (X2=43.172, P<0.0001).
Prevalence of Hepatitis C Virus After Laboratory Analysis
The prevalence of HCV was 4% which was highly lower than that obtained among the HIV patients taking antiretroviral therapy according to a cohort study carried out in Switzerland is 37.2% [21] but was slightly lower than that obtained at the Buea and Limbe regional hospitals in HIV patients of age 21 years and above 2.8% [23]. On the other hand, this prevalence was slightly similar to that obtained in two systematic reviews among people living with HIV in SSA 3% [3,22].
The prevalence of hepatitis C virus was significantly higher in participants from Kumba Subdivisional hospital (4/11.8%), X=6.178, p=046). As pertaining to blood transfusion hepatitis C virus (6/32 (18.8%), X2=20.202, P<0.0001) was significantly higher in participants who reported to have been transfused blood. In addition, participants who recorded poor level of knowledge on hepatitis C virus significantly had a high prevalence of hepatitis C virus, 9/79 (11.4%), compared to those who recorded good level of knowledge on hepatitis C virus, 3/220 (1.4%) (X2=15.176, P<0.0001).
The result showed that participants that have ever received blood from someone were 5.88 times more likely at risk to be infected with hepatitis B (95% CI: 2.04-16.94, P-values: 0.001), and 13.14 times more likely at risk to be infected with hepatitis C (95% CI: 3.04-56.81, P-values:0.001), than participants who have never received blood from someone. The participant’s area of residence also had a significant effect on hepatitis B virus prevalence. The odds are low for participants from urban areas (0.171 times that of those from rural areas). Therefore, participants from rural areas are 5.84 (1/0.171) times more at risk to be infected with hepatitis B than those from urban areas (95% CI: 0.044-0.660, P-values: 0.010). This may be due to the very low knowledge of the participants on the infection. Furthermore, participant’s treatment centers had a significant effect on hepatitis C virus prevalence. The odds are low for participants from Kumba District hospital (0.24 times that of those from Kumba Subdivisional hospital). Thus, participants from Kumba Sub-divisional hospital 4.14 (1/0.24) times more likely to be infected with hepatitis C virus than those from Kumba District hospital (95% CI: 0.06-0.84, P-values: 0.027). This could be due to improper counseling of the patients. As we found; reported rates of co-infections are considerably low in children of age less than 15 years [7]. Our study found that the rate of hepatitis B and C coinfections in HIV patients was very low in children and individuals of age less than 24 years. This could be due to improvement in the awareness on the importance of complete vaccination coverage among children in Cameroon. Furthermore, the rate of co-infection with hepatitis B and C was high in individual of age 25-34 years and 34-44 year respectively.
Effect of HBV/HCV on Response to HAART in HIV Patients During 24 Months of Evaluation
Out of the 52 HIV patients and 36 HIV/HBV patients, it was seen that there was anslight increase in weight over 6 months in both mono-infected and co-infected patients could be due to the response to HAART linked to proper follow up. Adherence to HAART in this population may be directly related to improvements in the CD4 cell count [30]. The fact that the decrease in viral load started after six months of treatment could be due the poor respect of treatment protocol before the beginning of follow up or the fact that the medication was not acting on the virus. The decrease in viral load and increase in CD4 could be linked to regular therapy and proper follow-up. The differences among the participants could be due to the differences in adherence to treatment and other factors such as alcoholic status, HIV stage at initiation, etc. We however, noted that irrespective of infection status, there were positive variations among these variables (CD4 and viral load) after 24 months though significant. This is in line with a study carried out in Bangkok and Thailand that came up with similar results [31]. The increase in CD4 in HIV/HBV patients after 24 months of HAART seem to show that HBV did not adversely affect HAART treatment in HIV patients in our study population [28]. HIV disease outcomes following first initiation of a HAART regimen was similar in HIV/HBV and HIV/HCV co-infected patients compared with HIVonly patients in terms of AIDS-free survival and detectable HIV virus during the 24 months. There were no greater differences in the immune response between the mono-infected compared with the co-infected and this was similar to a cohort study carried in Switzerland which showed an equivalent response in nearly 1600 HCV-positive and HCV-negative patients with respect to their ability to suppress HIV while receiving HAART [32].
The low increase in CD4 count in co-infected compared to monoinfected patients during the first year could be due to low immune response to HAART in co-infected patients. This was similar to the result of the study carried out on HIV/HCV patients after 24 months of HAART in Australia [28]. This cohort study shows that HIV/ HCV patients have a lower CD4 reconstitution, which is consistent with a meta-analysis study carried out by a group of scientists amongst HAART HIV–HCV co-infected patients that also indicated less immune reconstitution, as determined by CD4 cell count after 48 weeks of HAART [33].The gap observed in CD4 count between mono-infected and co-infected patients during the whole period of treatment could be linked to the difference in immune response. Indeed, the infection of HIV patients with hepatitis B or C may greatly affect the metabolism of liver, reducing it ability to properly absorb and metabolized ARV drugs.
There was a significant decrease in mean ALAT (p<0001) and ASAT (p< 0001) values from baseline to 24 month follow up. The co-infection whether for HBV or HCV leads to significant increase (p˂0.05) of transaminases all over the follow up periodcompared to mono-infected patients. Whether mono-infected or co-infected, therewas a significant decrease of ALAT and ASAT over the time from baseline to 24 months. The same variations were observed of total bilirubin level. These positive variations in transaminases could be due to the close follow-up of patients and good adherence to treatment.
There was also a slight decrease in albumin from baseline, but these changes were not statistically significant. All over the follow up period, the total bilirubin blood level gradually decreases both for HIV/HBV and HIV/HCV co-infected patients while for HIV mono-infected patients, it starts decreasing from month 6 till month 24. This variation could indicate a well functioning of liver cells that might be referred to the effect of either immune response to viral infections or the effect of HAART. In addition, Lamivudine use in the treatment of HIV may have an effect on HBV and therefore prevent the infection from being established as scientists have demonstrated this molecule to have effect on HBV [29]. We equally found a significant difference between creatinine baseline measurement and measurement after 24 months. The co-infection of HIV patients either with HBV or HCV leads to a significant increase (P˂0.05) of this parameter. This significant difference in creatinine level between mono-infected and co-infected HIV patients with HBV could be either due to the percentage change in creatinine from baseline or may indicate an adversed effect of these infections on the renal function of HIV infected patients. There was a general decrease in creatinine level in both mono and co-infected patients from month 6 to month 24 (HIV/HBV and HIV/HCV) and a total decrease of cratinine level for HIV/HCV from month 1 to month 24. This can be explained by the effect of HAART on the system of treated patient and may be indicating a well functionning of their kidneys.
Our study should be interpreted with caution due to a smaller sample size. The follow-up time (24 months) might not have been enough to evaluate all palpable effects identified in this study. However, despite these, our study reports the first attempt to understand the effects of hepatitis in a low resource programmatic setting.
CONCLUSION
The prevalence is respectively 12% and 4% for hepatitis B and C in Kumba Health District. Despite the high prevalence of these infections, the population of Kumba Health District does not still have a good understanding of the causes, signs/symptomes and the mode of transmission. Participant’s area of residence also has a significant effect on hepatitis B virus prevalence and patients who do not take their HAART regularly are more at risk for hepatitis B than those who take their therapy regularly. Human Immunodeficiency Virus disease outcomes following highly active antiretroviral do not appear to be adversely affected by HBV or HCV coinfection after 24 months in patients who respect their treatment protocol, but it is seen that there are differences in response to HAART between mono-infected compared to the co-infected patients, taking into consideration the, CD4 count, and viral load. Concerning the renal and liver functions, we observed a decreased and variations within the normal range of all the biomarkers in response to HAART during the 24 months after regular follow. The result of this study could be used for health decision making and proper follow up of HIV/HBV and HIV/HCV co-infected patients.
AUTHOR CONTRIBUTIONS
Conception and design of the study : Christopher Bonglavnyuy Tume and Innocent Mbulli Ali Investigation and acquisition of data: Adamu Ndongho Ndifontiayong, Jean Baptiste Sokoudjou, and Jerimiah Ndimumeh Mbogwe Analysis, interpretation of data and manuscript writing : Innocent Mbulli Ali and Jean Baptiste Sokoudjou Review and edition of the final version of the article : all authors.
DATA AVAILABILITY
The data used to support the findings of this study are available from the corresponding author and can be consulted upon request.
ACKNOWLEDGMENT
Authors thank all participants involved in this study for their availability and contribution.
REFERENCES
- Naghavi M, Wang H, Lozano R (2015) Global, regional and national age-sex specific all-cause and cause-specific mortality for 240 causes of death, 1990-2013: A systematic analysis for the Global Burden of Disease Study 2013. Lancet 385(9963): 117-171.
- Mokdad, Lopez A, Shahraz S, Rafael L, Ali HM, et al. (2014) Liver cirrhosis mortality in 187 countries between 1980 and 2010: A systematic analysis. BMC Med 12(145).
- Highleyman (2010) HIV/HBV and HIV/HCV co-infected people with impaired liver function and inflammation have higher risk of non- AIDS death in proceedings of the 17th conference on Retroviruses and Opportunistic Infections (CROI 10), Sans Fransico, USA.
- WHO (2013) Consolidated guidelines on the use of antiretroviral drugs for treating and preventing HIV infection: recommendation for public health approach.
- Rao V, Johari N, Cros DP, Messina J, Ford N, et al. (2015) Hepatitis C seroprevalence and HIV co-infection in sub-Saharan Africa: A systematic review and meta-analysis. Lancet Infect Dis 15(7): 819-824.
- Rotman Y, Liang T (2009) Coinfection with hepatitis C virus and human immunodeficiency virus: virological, immunological, and clinical outcomes. J Virol 83(15): 7366-7374.
- Umutesi J, Simmons B, Makuza JD, Dushimiyimana D, Mbituyumuremyi A, et al. (2017) Prevalence of hepatitis B and C infection in persons living with HIV enrolled in care in Rwanda. BMC Infect Dis 17(1): 315.
- Barth RE, Huijgen Q, Taljaard J, Hoepelman AI (2010) Hepatitis B/C and HIV in sub-SaharanA frica: An association between highly prevalent infectious diseases. A systematic review and meta-analysis. International Journal of Infectious Diseases 14(12): e1024-e1031.
- Azam A, Hakimi H, Nasiri BA, Hassanshahi G, Arababadi MK (2014) Prevalence of hepatitis b co-infection among HIV positive patients: Narrative review article. Iran J Public Health 43(6): 705-712.
- WHO (2011) Management of hepatitis B and HIV coinfection.
- Liaw YF, Brunetto MR, Hadziyannis S (2010) The natural history of chronic HBV infection and geographical differences. Antiviral Therapy 15(3): 25-33.
- Lemoine M, Nayagam S, Thursz M (2013) Viral hepatitis in resourcelimited countries and access to antiviral therapies: current and future challenges. Future Virology 8(4): 371-380.
- Wang H, Wolock T, Carter A, Nguyen G, Kyu H, et al. (2016) Estimates of global, regional and national incidence, prevalence and mortality of HIV, 1980-2015: The global burden of disease study 2015. Lancet HIV 3(8): e361-387.
- Di Bisceglie AM, Maskew M, Schulze D, Reyneke A, Mcnamara L, et al. (2010) HIV-HBV coinfection among South African patients receiving antiretroviral therapy. Antivir Ther 15(3): 499-503.
- Lodenyo H, Schoub B, Ally R, Kairu S (2000) Hepatitis B and C virus infections and liver function in AIDS patients at Chris Hani Baragwanath Hospital, Johannesburg. East Afr Med J 77(1): 13-15.
- Mphahlele MJ, Lukhwareni A, Burnett R, Moropeng LM, Ngobeni JM (2006) High risk of occult hepatitis b virus infection in HIV-positive patients from South Africa. J Clin Virol 35(1):14-20.
- Molu JP, Essome MCN, Monamele CG, Njouom R (2018) Sero-prevalence of HBsAg in naïve HIV-infected patients in a rural locality of Cameroon. BMC Res Notes 11(1):1-16.
- Zoufaly A, Onyoh EF, Tih PM, Awasom CN, Feldt T (2012) High prevalence of hepatitis B and syphilis co-infections among HIV patients initiating antiretroviral therapy in the Northwest region of Cameroon. Int J of STD and AIDS 23(6): 435-438.
- Shevell L, Meriki HD, Ngwa CF, Fuller C (2015) Epidemiology of human immunodeficiency virus-1 and hepatitis B virus co-infection and risk factors for acquiring these infections in the Fako division of Southwest Cameroon. BMC Public Health 15(1): 1-9.
- Winnock M, Ceron DS, Dabis F, Chene G (2004) Interaction between HIV- 1 and HCV toward a new entity. Journal of Antimicrobial Chemotherapy 53: 936-946.
- Greub G, Ledergerber B, Battegayetal M (2000) Clinical progression, survival, and immune recovery during antiretroviral therapy in patients with HIV-1 and hepatitis C viruscoinfection: the Swiss HIV cohort study. Lancet 356(9244): 1800-1805.
- Azevedo T, Zwahlen M, Rauch A, Egger M, Wandeler G (2016) Hepatitis C in HIV-infected individuals: a systematic review and meta-analysis of estimated prevalence in Africa. J Int AIDS Soc 19(1): 20711.
- Luma HN, Fiacre SAEB, Domin SME, Fernando KL, Olivier SD, et al. (2016) Seropprevalence and correlates of hepatitis B and C in two regional hospitals in Cameroon. The Open AIDS Journal 10(1): 199-208.
- Milazzo L, Antinori S (2014) Hepatitis virus and HIV interactions. Lancet 14(11): 1025-1027.
- Matthews PC, Beloukas A, Malik A, Jonathan C, Pieter J, et al. (2015) Prevalence and characteristics of hepatitis B virus (HBV) coinfections among HIV positive women in South Africa and Botswana. Plos One 10(7): e0134037.
- Xie J, Han Y, Qiuetal Z, Yijia L, Yanling L, et al. (2016) Prevalence of Hepatitis B and C viruses in HIV positive patients in China. J Int AIDS Soc 19(1): 20659.
- Bui VH, Kanxa YV, Ngyen VK (2014) HBV and HCV coinfections among HIV/AIDS patients in the National Hospital of Tropical Diseases, Vietnam. AIDS Research and Treatment 2014: 1-5.
- Lincoln D, Petoumenos K, Gregory DJ (2003) HIV/HBV and HIV/HCV Coinfection, and outcomes following highly active antiretroviral therapy. HIV Medicine 4(3): 241-249.
- Dore GJ, Cooper DA, Barrett C, Goh LE, Thakrar B, et al. (1999) Dual efficacy of lamivudine treatment in human immunodeficiency virus/ hepatitis B Virus-coinfected persons in a randomized, controlled study (CAESAR). J Infect Dis 180(3): 607-613.
- Wood E, Montaner JS, YiP B, Mark WT, Maetin TS, et al. (2004) Adherence to antiretroviral therapy and CD4 T-cell count responses among HIVinfected injection drug users. Antivir Ther 9: 229-235.
- Law WP, Duncombe CJ, Mahanontharit A, Boyd MA, Ruxrungtham K, et al. (2004) Impact of viral hepatitis co-infection on response to antiretroviral therapy and HIV disease progression in the HIV-NAT cohort. AIDS 18(8): 1169-1177.
- Sulkowski MS, Moore RD, Mehta SH, Chaisson RE, Thomas DL (2002) Hepatitis C and progression of HIV disease. 288: 199-206.
- Farmer MM, Clinton H, Margaret KJ, Rowley CF (2005) Impact of hepatitis C virus on immune restoration in HIV-infected patients who start highly active antiretroviral therapy: A Meta-analysis. Clinical Infectious Diseases 41(5): 713-720.
Article Type
Research Article
Publication history
Received Date: June 14, 2022
Published: July 13, 2022
Address for correspondence
Christopher Bonglavnyuy Tume, Research Unit of Microbiology and Antimicrobial Substances, Faculty of Science, University of Dschang, Cameroon
Copyright
©2022 Open Access Journal of Biomedical Science, All rights reserved. No part of this content may be reproduced or transmitted in any form or by any means as per the standard guidelines of fair use. Open Access Journal of Biomedical Science is licensed under a Creative Commons Attribution 4.0 International License
How to cite this article
Adamu NN, Innocent MA, Jean BS, Jerimiah NM, Christopher BT. Seroprevalence of HBV/HCV-HIV Co-infections and Outcome After 24 months of HAART in HIV Patients, in Kumba Health District, Southwest Region of Cameroon. 2022- 4(4) OAJBS.ID.000468.
Figure 1: The map of Kumbna Health District.
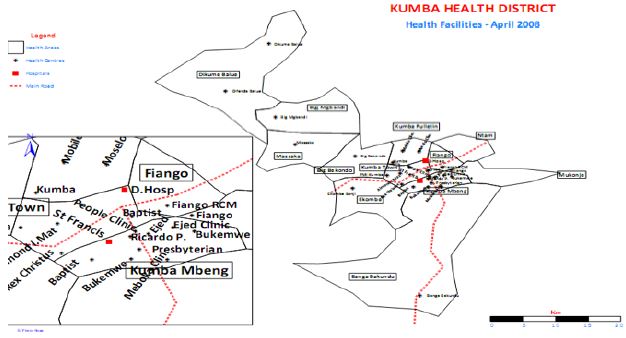
Figure 2: Summary flow diagram for the determination of the prevalence of hepatitis B and C and follow up of mono-infected and co-infected patients placed on HAART in KHD.
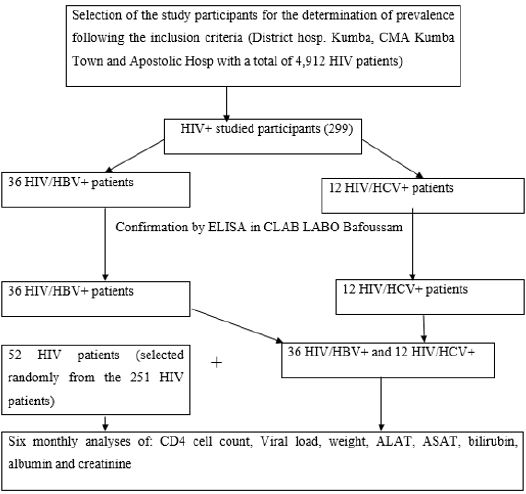
Figure 3: Overall level of participant’s knowledge on the modes of transmission and the signs/symptoms of HBV and C in Kumba Health District.
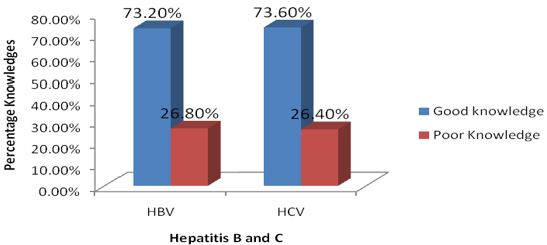
Figure 4: Prevalence of HBV among HIV patients in 2018 in Kumba Health District.
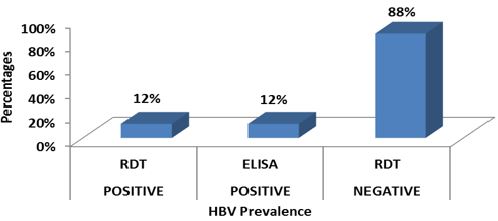
Figure 5: Prevalence of HCV among HIV patients in 2018 in Kumba Health District.
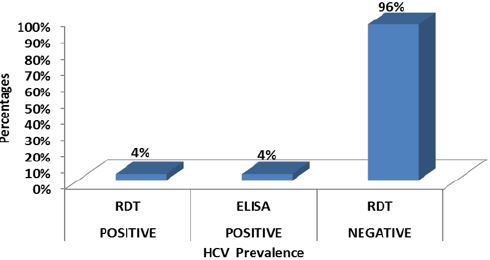
Figure 6: Mean variation of weights of patients from month 1 to 24 during the follow up in Kumba Health District.
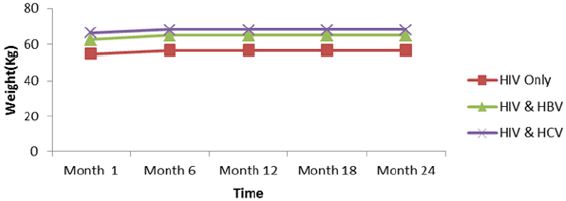
Figure 7: Mean variation of immune response (CD4 cells counts), of patients from month 1 to 24 during follow up of HAART in Kumba Health District.
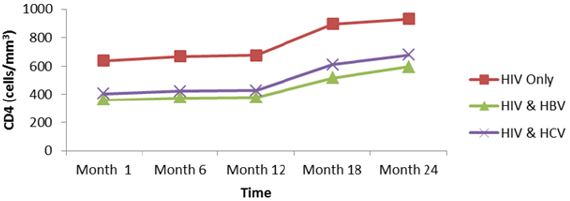
Figure 8: Mean variation of immune response (Viral loads), of patients from month 1 to 24 during follow up of HAART in Kumba Health District.
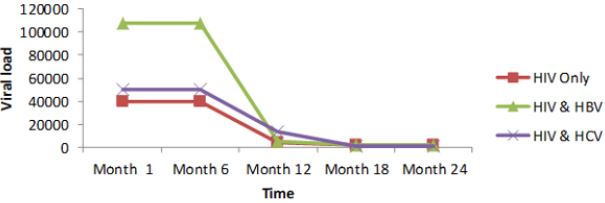
Figure 9: Mean variation of ALAT levels of patients from month 1 to 24 during follow up of HAART in Kumba Health District.
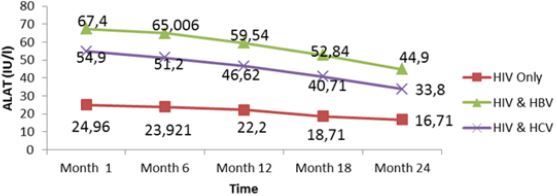
Figure 10: Mean variation of ASAT levels of patients from month 1 to 24 during follow up of HAART in Kumba Health District.
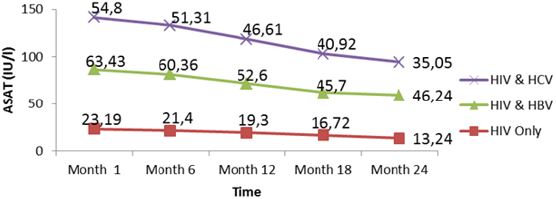
Figure 11: Mean variation of albumin levels of patients from month 1 to 24 during follow up of HAART in Kumba Health District.
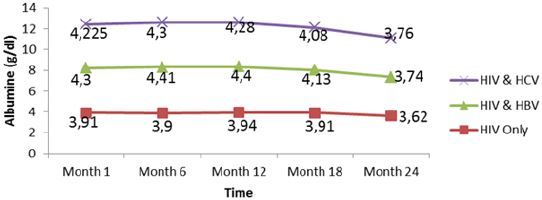
Figure 12: Mean variation of albumin levels of patients from month 1 to 24 during follow up of HAART in Kumba Health District.
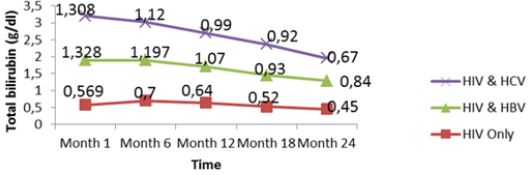
Figure 13: Mean variation of total creatinine levels of patients from month 1 to 24 during follow up of HAART in Kumba Health District.
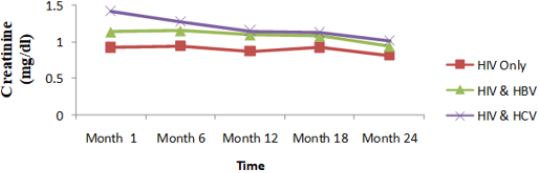
Table 1: Sociodemographic characteristics of the study participants in Kumba Health District, 2018.
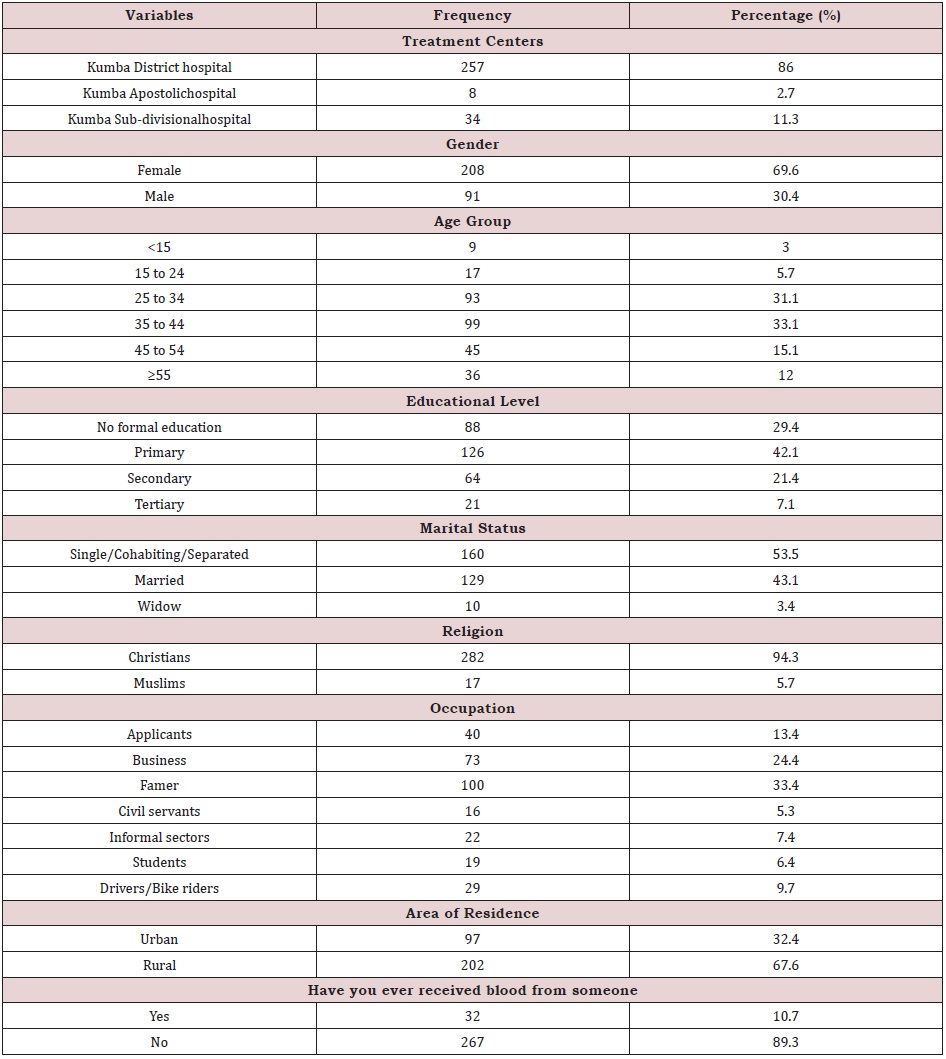
Table 2: Knowledge of participants on the modes of transmission and cardinal signs/symptoms of HBV/HCV Kumba Health District, 2018.
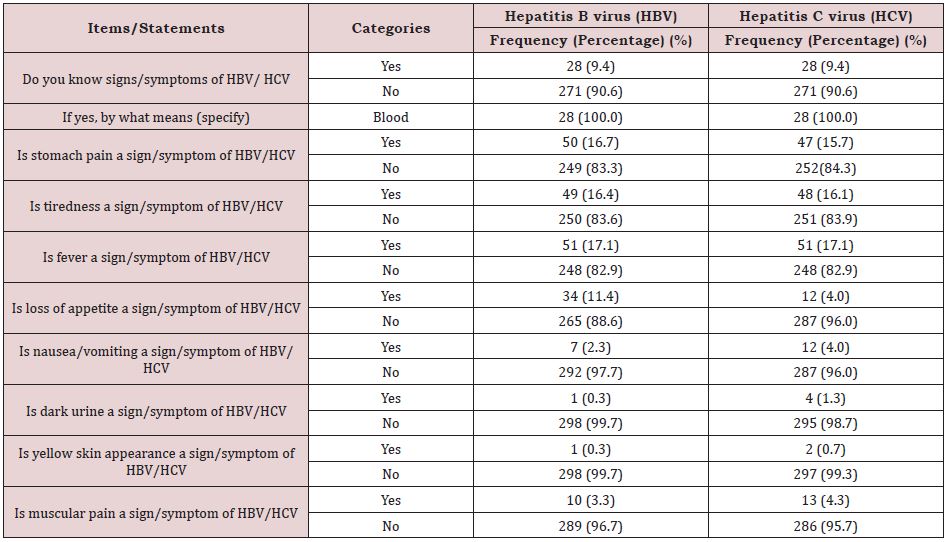
Table 3: Prevalence of HBV and HCV by sociodemographic characteristics and other associative factors in Kumba Health District in 2018.
*Statistically significant values.
Table 4: Risk factors of Hepatitis B and Hepatitis C viruses in Kumba Health District in 2018.
*AOR: Adjusted odd ratios
Table 5: Mean immune response measurements and percentage change from 1 to 24 months in co-infected and mono-infected patients in Kumba Health District in 2018-2019.
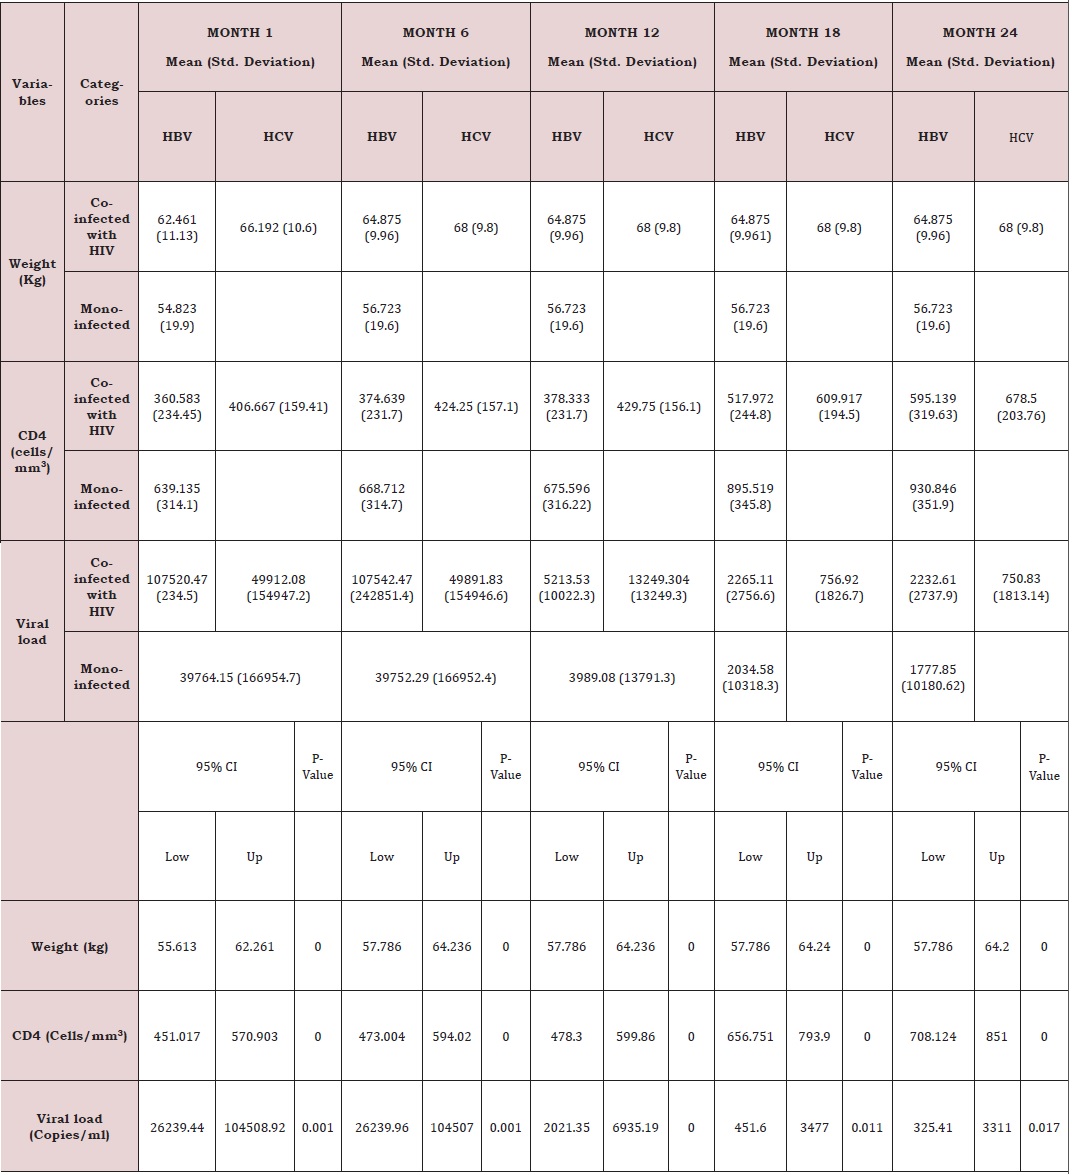
Table 6: Mean liver function measurements between 1 and 24 months in HIV/HBV and HIV/HCV co-infected and HIV mono-infected patients in Kumba Health District in 2018-2019.
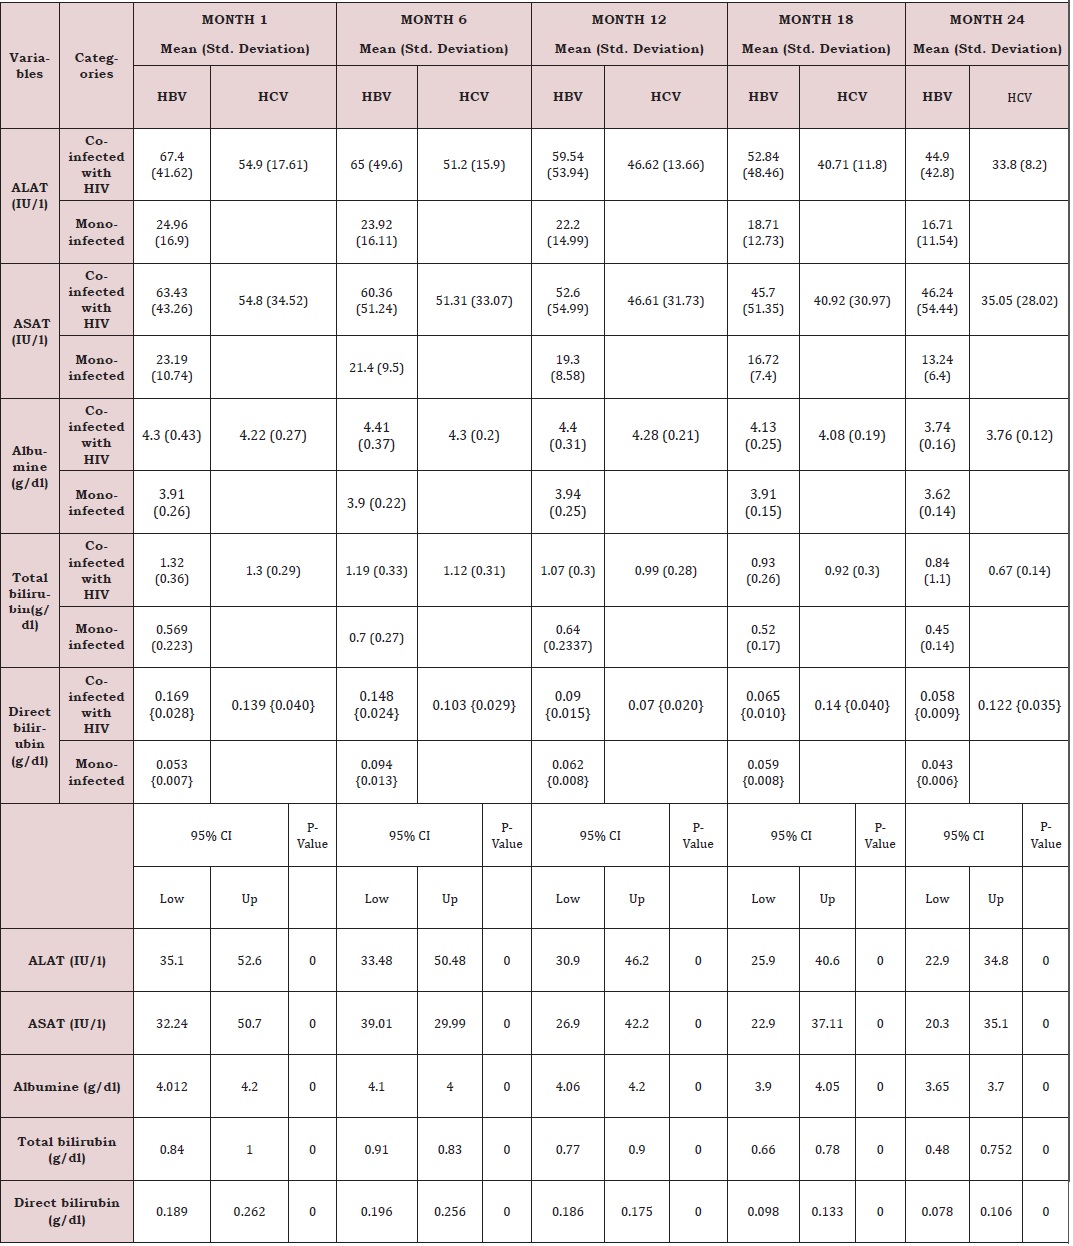
Table 7: Mean creatinine measurements between 1 and 24 months in HIV/HBV and HIV/HCV co-infected and mono-infected HIV patients in Kumba Health District in 2018-2019.