Segmentation Analysis of Impact on Glucoses via Diet, Exercise and Weather Temperature During COVID-19 Quarantine Period (No. 312)
ABSTRACT
In this paper, the author described his special segmentation analysis of impact on his glucoses via diet, exercise, and weather temperature during the COVID-19 quarantine period of 209 days, from 1/19/2020 through 8/14/2020. He segmented his carbs/ sugar amount, post-meal walking step, and ambient weather temperature into low range and high range. Then, he calculated the associated glucose values for each range. In the quarantine period, his finger PPG is approximately 109 mg/dL and his sensor PPG is around 119 mg/dL. His average carbs/sugar intake amount is 12.2 grams (exceptionally low) and his post-meal walking is 4,305 steps (sufficiently high). The ending measured glucoses contributed by his two ranges of diet and exercise (low ranges and high ranges) are sufficient and matched with his previous findings. As expected, the weather temperature provides no significant variances on glucoses due to the mild weather pattern and its low contribution of ~5% to glucoses. In this investigation, the majority of his glucose readings are normal, which are below 120 mg/dL. This is due to his diabetes control that reached its best performance period over the past 25 years of having diabetes. The relationship between inputs, diet and exercise, and outputs, finger PPG and sensor PPG are not fundamentally different from his previous findings; however, the deviations between the low range and high range of diet and exercise during this period are relatively small. The usage of the segmentation modelling and analysis has its own merit and can definitely be beneficial for data analyses from his other periods or from other T2D patients.
INTRODUCTION
In this paper, the author described his special segmentation analysis of impact on his glucoses via diet, exercise, and weather temperature during the COVID-19 quarantine period of 209 days, from 1/19/2020 through 8/14/2020. He segmented his carbs/ sugar amount, post-meal walking step, and ambient weather temperature into low range and high range. Then, he calculated the associated glucose values for each range.
METHOD
Background
Since 1/1/2012, the author has collected his vital medical conditions as biomarker values, including weight, glucose, blood pressure, and lipids, along with lifestyle details, including food, drinking water, sleep, stress, exercise, daily life routines. In addition, he incorporated key environmental factors such as weather temperature, pollution, water quality, poison, and radiation, which are stored in a cloud server and managed via a customized APP software on his iPhone. Thus far, he has collected and processed nearly 2 million data.
He studied mathematics, physics, computer science, structural and mechanical engineering, business statistics in different colleges for 17 years. He worked in industries of defense, nuclear power, computer hardware and software, electronics, and semiconductors. In addition, he has self-studied psychology for 9-years, internal medicine and food nutrition for the past 10 years. Based on his multi-disciplinary training, he has developed his GH-Method: mathphysical medicine methodology for his biomedical research work during the past decade. To date, he has written 312 medical papers, published 250+ papers on peer-reviewed medical journals, and attended 65 medical conferences to give 120 oral presentations.
GH-Method: Math-Physical Medicine (MPM) Methodology
The description below explains the GH-Method: MPM research methodology developed by the author utilized in his biomedical research [1].
Any system, whether medical, political, economic, engineering, biological, chemical, and even psychological have causes or triggers (inputs) and consequences (outputs). There are definitely some existing connections between inputs and outputs that can be either simple or complicated. The inputs and outputs of any type of system, including biomedical system, can be observed visually or measured by certain instruments. These physically observed phenomena, including features, images, incidents, or numbers are merely the partial “physical expression” of these underneath system structure. This system structure includes human organs for a biomedical system, the human brain for a neurological or mental system, or steel plate/pipe for structural or mechanical engineering system [2].
Once we have collected these readings of the physical phenomena (external expression, similar to a behaviour, symptom, or response), through either incident, image, or data, we should be able to organize or categorize them in a logical manner. When we check or analyse these partial physical phenomena outputs and cannot figure out why they act or behave in certain way due to internal causes, reasons, or stressors, we can try to develop some guesses or formulate some reasonable hypotheses based on some available basic principles, theories, or concepts from physics. At this point, we just cannot pull out an existing equation from a physics textbook and insert these input variables in to conduct a “plug and play” game. An equation is an expression of a concept or a theory, which is usually associated with some existing conditions, either initial or boundary; however, a biomedical system usually has different kind of conditions from other systems.
After understanding the meaning of observed physical phenomena, the next step is to prove the hypothesis, guess, or interpretation of the phenomenon being correct or incorrect. At this stage, a solid understanding of mathematics becomes extremely useful to develop a meaningful model which could represent or interpret these observed physical phenomena and created hypothesis. In addition, some engineering modelling techniques, such as finite element method and computer science tools, including software, artificial intelligence (AI), and big data analytics can offer great assistance on verification of analysis results from these mathematical operations [3].
If the mathematical results cannot support the created hypothesis, then a new hypothesis needs to be formulated. When this new hypothesis is proven to be correct, then we can extend or convert this hypothesis into a useful mathematical equation or into a simpler arithmetical formula for others to adopt this easier way of thinking and understanding of the results. In the final stage, the derived mathematical equation or arithmetical formula can then be used to “predict” future outcomes of the selected system based on other different sets of inputs.
Diabetes Research
The author has been a severe type 2 diabetes (T2D) patient since 1995. He has developed many serious complications and finally, in 2010, they became life-threatening. Therefore, he has spent the next 10 years to self-study and research diabetes, metabolism, and endocrinology, in order to save his own life.
He spent his first four years, from 2010 to 2013, to selfstudy 6 chronic diseases, i.e. obesity, diabetes, hypertension, hyperlipidemia, cardiovascular diseases, stroke, as well as food nutrition. Food is probably the most important and also complicated input element to influence these chronic diseases. After his first 4 years of self-learning, he then spent the entire year of 2014 to develop a complex model of metabolism. This mathematical model contains 4 biomarkers of medical conditions (weight, glucose, blood pressure, and lipids) along with 6 lifestyle details (food portion and nutritional balance, drinking water intake, adequate exercise, sufficient sleep amount and quality, stress reduction, and daily life routines regularity). He applied the concept of topology from mathematics and the approximation modelling technique of finite element method from engineering to develop this metabolism model which became the cornerstone of his future medical research work. As a result, his overall health conditions also started to be improved [4].
Starting from 2015, he spent three consecutive years, from 2015 to 2017, to discover the characteristics and behaviour of this complex “wild beast” of glucose. His major objective is to truly understand the “inner characteristics” of the glucose, not just using medication’s chemical power to control the disease’ external biological “symptoms”. His research work is similar to a horseman trying to tame a horse by understanding its temperament first, not just giving a tranquilizer to calm it down. As a result, during this period of 3 years, he has developed 4 prediction models, which include Weight, PPG, FPG, and HbA1C with extremely high prediction accuracy (95% to 99%) to reach to his purpose of “understanding glucoses”.
The author estimated and proved that PPG contributes approximately 75% to 80% towards HbA1C formation. Therefore, he tried to unravel the mystery of PPG first. Through his diabetes research, he has identified at least 19 influential factors associated with PPG formation. Among those influential factors, diet (carbs/ sugar intake amount) would provide ~38% and exercise (post-meal walking) would contribute ~41%. Combining these two primary influential factors, it gives ~80% of the PPG formation. Among the rest of the 17 secondary factors, a high weather temperature contributes ~5%, whereas stress and illness only make noticeable contributions when they occur [5].
For most T2D patients who take medication, its biochemical effect would become the most significant influential factor of glucose. However, as we know, medication cannot cure diabetes and only control its symptoms. Therefore, the author decided to focus on controlling diabetes at the most fundamental core level by investigating its root cause. Previously, he has taken high doses of three prescribed diabetes medications for 18 years since 1997; however, in 2013, he started to reduce the number of prescriptions and dosages of his daily medications. By 12/8/2015, he finally ceased taking any diabetes medications.
On 3/16/2017, he discovered a solid statistical connection between his FPG and his body weight with a >90% correlation coefficient. In addition, similar to his PPG research, he also recognized that there are about 5 influential factors of FPG formation with weight alone contributing >85% and cold weather temperature influencing ~5%.
Since July of 2019, he also launched a special investigation on the degree of damage to his pancreatic beta cells. Over the past 12-months of research work, he noticed that his FPG and PPG have been decreased in the past 6 to 8 years at an annual rate of 2.2% to 3.2%. In other words, his pancreatic beta cells have been selfregenerating or self-repairing about 13% to 26% over these 6-8 years. He then thought about FPG as being a good indicator on how healthy his pancreatic beta cells are since there are no food intake and exercise while sleeping. In addition, for the last 5 years, his body weight has been maintained around 172 lbs., without the use of medication as well. It makes sense that FPG carries a significant and clear message about his health status of pancreatic beta cells; therefore, it can be served as the baseline of his overall glucose predications. The detailed explanation of his glucose research work is provided because this particular study is based on “glucoses” [6].
RESULTS
In Figure 1, it illustrates the history of COVID-19 (virus) in the United States in terms of confirmation and death numbers. The confirmation percentage is defined as the confirmed cases divided by the US population and the death percentage is defined as the death cases divided by the confirmed cases. Although this virus presented in March 2020, the author started his quarantined lifestyle on 1/19/2020. This unique and special lifestyle has significant impact on his overall health conditions, including diabetes control. In relative terms, his diabetes control situation over the past 7 months has reached to its “best historical status” for his 25 years of having diabetes.
In Figure 2, the results of his segmented diet analysis are shown during this virus period with a low range of carbs/sugar intake amount between 0 to 14 grams (398 meals and 63%), an average finger PPG of 109 mg/dL, and average sensor PPG of 121 mg/dL. His high carbs/sugar intake amount is between 14 to 80 grams (9,246 meals and 37%) with an average finger PPG of 113 mg/dL and average sensor PPG of 130 mg/dL. As expected, the high range of carbs/sugar provides higher PPG values. His average carbs/ sugar intake amount for the entire virus period is 12.2 grams with an average finger PPG of 109 mg/dL and average sensor PPG of 119 mg/dL.
In Figure 3, it reveals his results of segmented exercise analysis during this virus period. His low range of post-meal walking steps is between 0 to 3,000 steps (87 meals and 14%) with an average finger PPG of 115 mg/dL and average sensor PPG of 128 mg/dL. His high range of post-meal waking steps is between 3,000 to 10,000 steps (536 meals and 86%) with an average finger PPG of 109 mg/dL and average sensor PPG of 123 mg/dL. As expected, high range of walking steps provides lower PPG values. His average post-meal walking amount for the entire virus period is 4,305 steps with an average finger PPG of 109 mg/dL and average sensor PPG of 119 mg/dL.
In Figure 4, it depicts his results of segmented weather temperature analysis during this virus period. His low range of weather temperature is between 0 to 72-degree °F with an average finger PPG of 110 mg/dL and average finger FPG of 110 mg/dL as well. His high range of weather temperature is between 72 to 120-degree °F with an average finger PPG of 110 mg/dL and average finger FPG of 101 mg/dL.
The higher and lower weather temperature ranges provide similar results of PPG value because the average weather temperature for the entire virus period is 70-degree °F (an area with a “Mediterranean weather” pattern) with an average finger PPG of 110 mg/dL and average finger FPG of 106 mg/dL [7].
In Figure 5, it shows the finger and sensor PPG values versus carbs/sugar intake amount and post-meal walking steps during the virus period “without segmentation models”
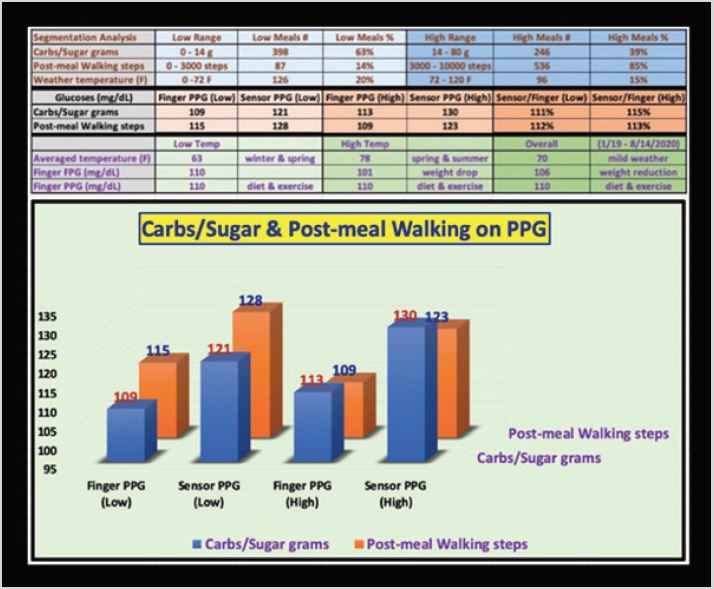
The conclusive figure of this article is shown in Figure 6. The top diagram is the background data table and the bottom diagram is the bar chart of the finger PPG and sensor PPG for the low and high ranges of diet and exercise. The results correspond completely with his previous research findings. In his previous paper regarding weather temperature, the study results do not surprise him due to the mild Mediterranean weather pattern and weather temperature as a secondary influential factor, which contributes a 5% to a maximum 10% of both PPG and FPG formations.
From the data table and bar chart, notice the following percentage differences between sensor PPG and finger PPG:
Low diet: 11%
High diet: 15%
Low exercise: 12%
High exercise: 13%
The continuous glucose monitor sensor measured PPG is between 11% to 15% higher than the finger-pierced PPG [8].
CONCLUSION
In this investigation, the majority of his glucose readings are normal, which are below 120 mg/dL. This is due to his diabetes control that reached its best performance period over the past 25 years of having diabetes. The relationship between inputs, diet and exercise, and outputs, finger PPG and sensor PPG are not fundamentally different from his previous findings; however, the deviations between the low range and high range of diet and exercise during this period are relatively small. The usage of the segmentation modelling and analysis has its own merit and can definitely be beneficial for data analyses from his other periods or from other T2D patients.
REFERENCES
- Hsu GC (2020) GH-Method: Methodology of math-physical medicine. Adv Nutri and Food Sci.
- Hsu GC (2020) Controlling type 2 diabetes via artificial intelligence technology using GH-Method: math-physical medicine. Journal of Biotechnology and Immunology 2(2).
- Hsu GC (2020) Guesstimate probable partial self-recovery of pancreatic beta cells using calculations of annualized glucose data using GHMethod: math-physical medicine. Medical & Clinical Research 5(5): 73- 75.
- Hsu GC (2020) Using wave characteristic analysis to study T2D patient’s personality traits and psychological behaviour using GH-Method: mathphysical medicine. Journal of Addiction Research 4(1): 12-13.
- Hsu GC. Trending pattern analysis and progressive behaviour modification of two clinic cases of correlation between patient psychological behaviour and physiological characteristics of T2D Using GH-Method: math-physical medicine & mentality-personality modelling.
- Hsu GC. Using GH-Method: math-physical medicine, mentalitypersonality modelling, and segmentation pattern analysis to compare two clinic cases about linkage between T2D patient’s psychological behaviour and physiological characteristics.
- Hsu GC (2020) Using artificial intelligence technology to overcome some behavioural psychological resistance for diabetes patients on controlling their glucose level using GH-Method: math-physical medicine & mentality-personality modelling. Journal of Educational and Psychological Research 2(2): 61-62.
- Hsu GC (2020) A comparison of three glucose measurement results during COVID-19 period using GH-Method: math-physical medicine. Journal of Biotechnology and Immunology 2(4).
Article Type
Research Article
Publication history
Received date: September 30, 2020
Published date: November 09, 2020
Address for correspondence
Gerald C Hsu, eclaireMD Foundation, USA
Copyright
©2020 Open Access Journal of Biomedical Science, All rights reserved. No part of this content may be reproduced or transmitted in any form or by any means as per the standard guidelines of fair use. Open Access Journal of Biomedical Science is licensed under a Creative Commons Attribution 4.0 International License
How to cite this article
Gerald CH. Segmentation Analysis of Impact on Glucoses via Diet, Exercise and Weather Temperature During COVID-19 Quarantine Period (No. 312). 2020 - 2(6) OAJBS.ID.000233.
Figure 1: COVID-19 historical data.
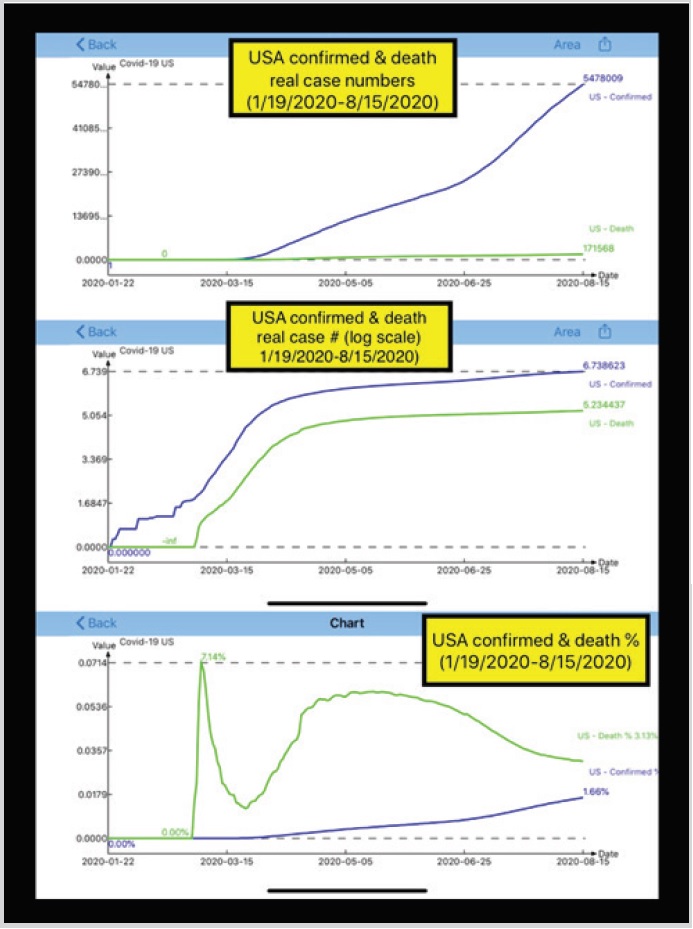
Figure 2: Low range and High range of carbs/sugar intake amount.
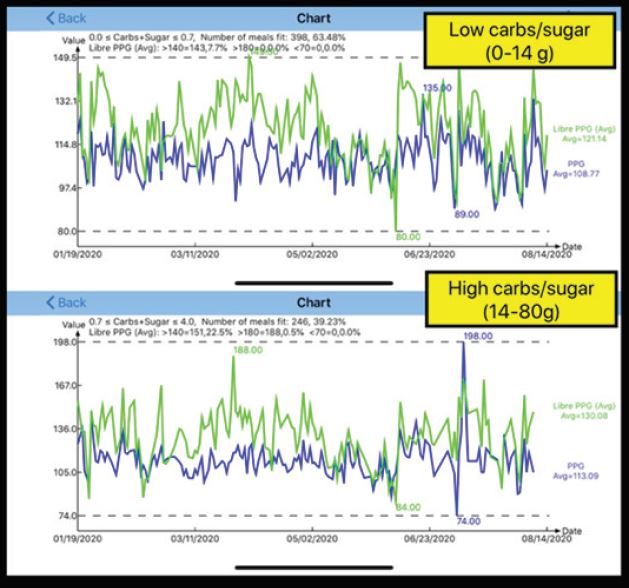
Figure 3: Low range and High range of post-meal walking steps.
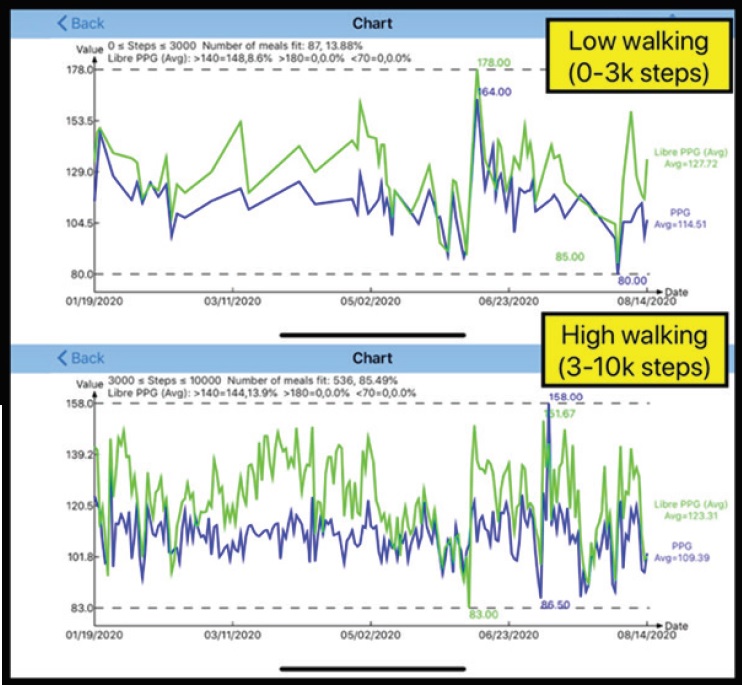
Figure 4: Low range and High range of weather temperature.
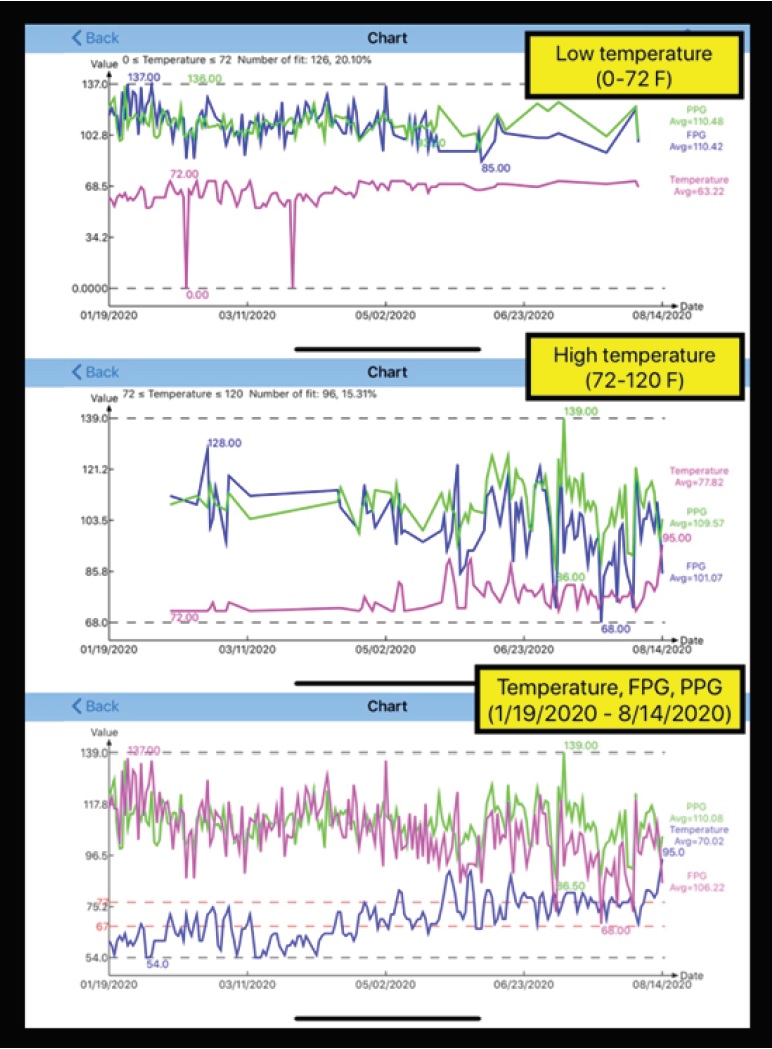
Figure 5: Diet, exercise, PPG of total virus period (no segments).
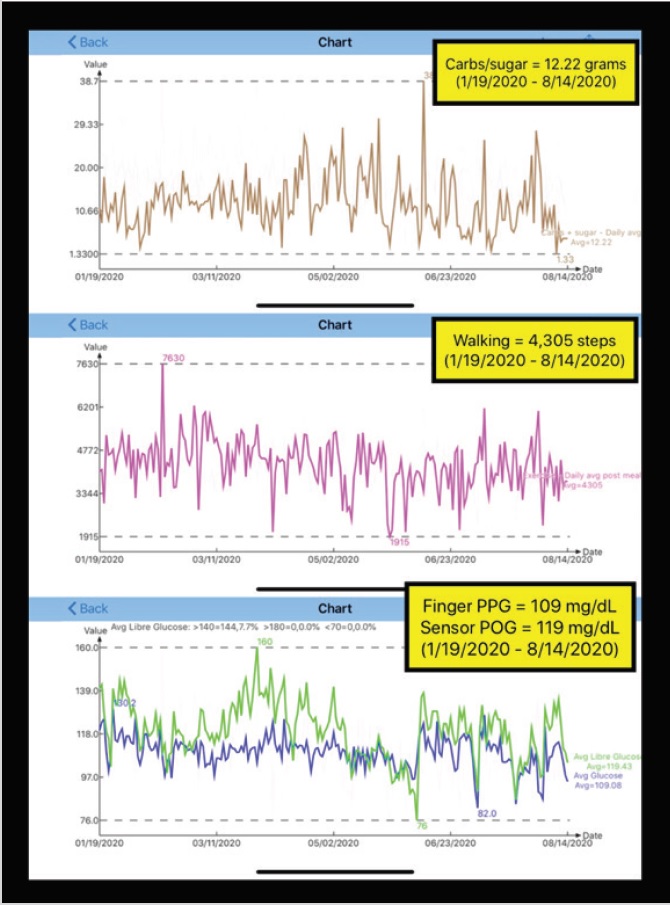
Figure 6: Data table and Bar chart of both low range and high range of diet and exercise.