Determination by Chromatographic Methods of Degradation Products of Thiamine 100mg Injection
ABSTRACT
Injectable solution of Thiamine is a pharmaceutical prepared that participated in many chemical reactions of the body and is very use in vitamin and nutritional preparations. B1 is a hydrosoluble (water-soluble) vitamin very sensitive to light, temperature, and oxidation increasing significantly its kinetic degradation when it is under exposure of those physic-chemical agents. Different studies of stability evidence that after 12 months the solution take a yellow light coloration, that intensify with the time, nonfulfillment the quality specifications as for organoleptic characteristics during the 24 months of validity. To improve the quality a redraw of formulation was done, changing the microbial preserver from Phenol to Chlorobutanol. Using different analytical techniques Thiamine storage stability in solution was monitored over time to determine the effect of different degradation agents like HCl, NaOH, H2O2, and thermolisis and photolysis. Degrading agents that more affect the used samples were NaOH and thermolisis.
KEYWORDS
Thiamine; Vitamin B1; Chemical stability; Degradation; NaOH; Thermal degradation
INTRODUCTION
Cuban Biopharmaceutical Industry has the responsibility to produce medications using a high technology from the scientifictechnological development of the country. Since many years, Cuba occupy one of the first places among Latin-American countries in the field of medical sciences, especially the biotechnology and pharmaceutical industry [1].
In medications, any present substance that does not belong to chemical entities named pharm or excipient is denominated impurity and very closed with all of them are find out the degradation products. Chemical changes be able to the time or by the action of different environmental factors [2]. Control and monitory of impurities in Pharmaceutical Active Ingredients (PAI) and finished products constitute today a crucial problem in the development and manufacture of medications.
Several impurities be possible due to PAI degradation or some interaction with the container material and its time of storage, because of is necessary to carry out predictive studies of formulations to assure the safety of pharmaceutical preparation [3].
Thiamine (vitamin B1) is an essential micronutrient in the human diet, found both naturally and as a fortification ingredient in many foods and supplements. However, it is susceptible to degradation due to heat, light, alkaline pH, and sulfites, among effects from other food matrix components, and its degradation has both nutritional and sensory implications as in foods [4].
Thiamine (vitamin B1), the first vitamin to be discovered, is an essential nutrient that is involved in many physiological activities in the human body, including energy metabolism; synthesis of several neurotransmitters; and tissue, brain, and organ functions. As a result of being a water-soluble vitamin, thiamine is held in reserve in the body only for 2-3 weeks; therefore, continuous dietary intake of thiamine is important for maintaining health. The recommended daily thiamine intake is 1.2mg [5,6].
When considering the physiological functions of thiamine, it is not surprising that its deficiency results in serious disorders, manifesting within 10 days with symptoms such as irritability, fatigue, weight loss, confusion, and blurred vision, with the potential to lead to the more severe Wernicke-Korsakoff syndrome, beriberi, or Leigh syndrome [7].
Thiamine storage stability in solution evidenced that after 12 months of storage the solution was taking a yellow light coloration avoiding that the product reaches the 24 months of validity. For that reason, a redraw in the preservative was done, changing Phenol by Chlorobutanol. The aim of this research was to determine by chromatographic methods the degradation products of an injectable solution of Thiamine 100mg using several degrading agents.
MATERIALS AND METHODS
Samples
To design the research authors used the methodology to determine the impurities when is not dispose standards of degradation products or impurities [8]. Two salts of thiamine hydrochloride were used in this study (Code MA.004.003.15, Germany), be fulfilled in 2016 and 2015, respectively. The sample of Chlorobutanol (Code MI.012.002.15, Germany) and two lots of finished products from 2016 (T16003) and 2013 (T13003), respectively. The last one under stability research. All those samples with the exception of T13003 were subjected to different stress conditions.
Acid Hydrolysis
To develop the degradative process, were weigh 2 g of the sample of thiamine hydrochloride 2016, was added 25 mL of distilled water and 1mL of HCl 1N, having a concentration of 80mg/mL. In the other hand, 1g of the sample of 2015 was weigh and dissolved in 10mL of distilled water with 1mL of HCl 1N. The sample of Chlorobutanol was prepared first as a placebo, at 0.5% of concentration, and later 5mL of that solution were added into an erlenmeyer with 1mL of HCl 1N to measure the degradation process.
Degradation of finished products were done using 9 bulbs from the selected lot (T16003), and the sample was distributed in equal parts in test tubes with 2mL of HCl 1N, and after that were introduced in a heat bath for 1 hour to accelerate the degrading process.
Basic Hydrolysis
Basic degradation process was done taking 2g of thiamine hydrochloride with 25mL of distilled water and 1mL of NaOH, having a final concentration of 80mg/mL. 1g of the sample from 2015 was mixed with 10mL of distilled water and 1mL of NaOH 1N. 5mL of Chlorobutanol at 0.5% were added to 1mL of NaOH 1N in an erlenmeyer to get the same purpose. The same procedure was done with the finished products, adding 2mL of NaOH 1N and heating the mixture during 1 hour in heating bath.
Oxidation Process
To realize the oxidation process, previous steps were followed acid and basic degradation: 2g of the sample mixed with 25mL of distilled water and 1mL of H2O2 30 %, to get a final concentration of 80mg/mL. Sample from 2015: 1g mixed with 10mL of distilled water and 1mL of hydrogen peroxide. 5mL of Chlorobutanol at 0.5% were mixed with 1mL of hydrogen peroxide at 30%. The finished product was submitted to the same procedure: 2mL of H2O2 at 30% and heated in heat bath for 1 hour.
Thermal Degradation
To realize this assay only were taking samples from the placebo and the finished product (T16003), and exposure to a temperature of 60 °C for 30 days.
Photolysis Degradation
To this assay only samples of the finished product (T16003), were exposure to the sunlight for 3 days, but not directly.
TLC
The assay of TLC was done using plates of silica gel 60 F254 on glass card (20x20cm), using as mobile phase 25 mL of distilled water, 50mL of glacial acetic acid and 50mL of n-Butanol (1:2:2 v/v/v). The glass chamber was conditioned during 2 hours with the solvent system. After chamber saturation, the plates were introduced and after the running were dried at room temperature and later in stove at 80 °C during 30min to remove completely the mobile phase. The revealing of the plates was done under a chromatographic chamber with UV lamp at 254nm of wavelength. Later on, the plates were placed under an iodine chamber, previously prepared.
For this purpose, each solution of the samples was diluted to get a final concentration of 1,6mg/mL, taking 2 mL of each preparation and dissolving into 100mL of methanol. Equally the samples of lot T16003 and T13003 were prepared, reaching a concentration of 2mg/mL. After all samples preparation, the doting on the plates was done using micropipettes at 20 and 50μL and a syringe of 250μL, respectively.
UV-Vis Spectrophotometry of the Samples
Thiamine hydrochloride samples (1g/1mL of distilled water) were degrading under different conditions (HCl, NaOH and H2O2). After degradation two aliquot of 0.5mL were added in a volumetric flask of 50mL to get a final concentration of 0.01mg/mL. Samples were analyzed in an UV/Vis Spectrophotometer (Jasco, Japan) between 200-500nm of wavelength.
HPLC analysis of the Samples
To know the degradative process of the samples, those samples were submitted to a HPLC analysis using the technique describe by BP in 2013, with little modifications. To this, a HPLC Knauer (Germany) equipped with a double piston pump Smartline K-1000, an UV-Vis detector (DAD K-2600) and autosampler injector (20μL), Column C-18 [250x4.6mm, 5μm (i.d)] (Apollo, USA). Mobile phase (MeOH: Sodium hexanosulphonate) (40:60v/v), adjusted with phosphoric acid (pH 3.1), flow 1mL/min.
RESULTS AND DISCUSSION
Acid Hydrolysis
Figure 1 shows the results of both samples degradation (2016 and 2015, respectively) with HCl 1N. In the first case, solution showed a signal at 8.3min of retention time, appearing other signals between 3-5min of retention time. The sample from 2015 showed a signal at 8.8min and another two signals between 3-4min, indicating that both solutions were degraded in acid medium. Both main signals showed a variation of 31% between the areas of both samples.
Thiamine suffers a hydrolysis in absence of oxygen, where the nature of the reaction is pH depending. According to USP 35 [9]; Mohammad et al. [10]; Williams et al. [11], and Williams [12], at least four separated reactions were suggested that bear to the formation of oxythiamine (pH bellow 1.0), 2-methyl-4-amino-5- hydroxymethylpirimidine (pH between 1.0-6.0), hydroxyl ions catalysis from pronated thiamine to produce pyrimidine and thiazole (pH between 2.0-6.5) and the rupture in aqueous medium of thiol thiamine to produce 2-methyl-4-amino-5-aminomethyl pyrimidine (pH above 6.5) as is shown in Figure 2.
After reaction of both samples of thiamine hydrochloride (2015; 2016) with NaOH 1N, the solution took an intense yellow coloration that become clearer after agitation with a pH of 12.3, as is shown in Figure 3.
Signals between 3 and 5min increase their size, while the signal of the main peak have a similar behavior of acid hydrolysis with a retention time of 8.3min, appearing a signal slightly increased around the 10min. Comparing with the sample from 2016, sample from 2015 was totally degraded, because the main peak disappear diminishing in more than a 90%.
Consulted references inform that thiamine is unstable in alkaline and neutral solutions. In front of a strong base, a process of acid-base equilibrium take place, where a yellow substance (III) appears such as is shown in Figure 4, according to Equihua [13] and Connors [14].
The reaction of finished product with NaOH provoked a change in the coloration from transparent to strong yellow, that after one hour in a heat bath, arising volatile compounds with a strong odor. That situation is similar to the thermolisis process (thermal degradation) explained by Dwivedi & Arnold [15].
Reaction of thiamine hydrochloride with hydrogen peroxide at 30% showed that vitamin was dissolve completely and solution took a pH value of 2.8. Chromatograms shows the presence of little signals at 3-4min of retention time like in previous degradations. Main signal had the same behavior, keeping the retention time of 8.3min. Moreover, evidenced is the degradation in the sample of 2015, due to the presence of another signal between 3-5min and the main peak was deformed, a signal at 8.3min and a shift to 8.6min as is shown in Figure 5.
Thiamine can be degraded in presence of sulfites, more evidenced when the vitamin is in solution form [14], being thiochrome one of degradation products mentioned by researchers who’s its structure is shown in Figure 6.
The results reached by Ribeiro et al. [16], after submit a standard solution of vitamin B1 with a concentration of 40μg/ mL to stress with H2O2 at 3% and 10% during 24 hours at room temperature, showed that after 6 hours of oxidative stress, the remaining values of the compound overtake were between 74.7% and 59.8%, respectively, while after 24 hours, this value was of 12.7%, indicating that degrading agent increase with the time the degradation of vitamin B1, substantiating the selectivity of develop method.
Thermal Degradation (thermolisis)
To develop the thermal degradation process were taken samples from the placebo (chlorobutanol 0.5%) and the finished product. Placebo keep the same retention time like in previous degradations. Samples of lot T16003 after 30 days of exposure at 60 °C acquired a yellow coloration corroborating the reported in consulted references. Heat is one of the agents that destroy the thiamine in solution [17,18].
Chromatograms in Figure 7 shown a decrease in 16% in the area of the main peak and in the retention time of thiamine that now is 8.1min comparing with the sample without degradation. Signals at 3-4min appearing magnified. The shoulder observed in peroxide degradation is present again and magnified, suggesting the transformation of the main product under this condition.
In spite of the consulted bibliography [19] report that the finished product is degrade by light, in our research, this situation was not verified, because the differences between the degraded sample and non-degraded sample as is shown in Figure 8. This result was produced due to the little time of exposure of the bulbs to light or not incidence of light onto the product.
Research realized to vitamin B1 to determine if under photo protection conditions was affected or no the product, after 72h of storage, residual amounts of vitamin at 4 °C were in the order of 96.4%±3.1%; at 25 °C with photo protection was 92.4%±3.1%, while at 25 °C without photo protection was of 95%±7.6%, demonstrating that the product is degraded in presence of sunlight when its exposure to the time under this degrading agent [16,20].
TLC analysis of the Samples
After samples preparation, each sample was dot on the plates with a final concentration of 1.6mg/mL. Seven different samples were use in the assay: USP pattern, placebo, FP without degradation, B1 degraded in NaOH, in H2O2, in HCl, and FP degraded at 60 °C from lots T16003 y T13003.
Under ordinary light no presence of spot was observed in chromatoplates. Under UV254 nm light, was appreciated the presence of violet spots in all analyzed samples, except for the sample of placebo because it does not contain the pharmaceutical active ingredient (PAI). No secondary spots were observed in USP pattern suggesting that this sample was not degraded, but in the rest of them, two well defined spots were appreciated near to the solvent front, indicating the degradation of the samples after their submission of degradation process (Figure 9). Lot T13003 has a low intensity in its coloration due to the time of validity.
After under iodine reveal of the plate, was appreciated the same situation like under UV exposure, but with the difference that only two spots appeared for degraded product of lots T16003 and T13003. All samples have a yellow brick coloration but with their tonality increased to the concave part of the spot that have an intense yellow-orange coloration (Figure 10). According to BP [8] and Connors [14], the metabolites of thiamine include pyrimidine, oxothiamine or thiazole, thiochrome, oxythiamine and sulfate of thiamine ester.
Our results are novel because even though in consulted bibliography is reported values of Rf to thiamine, the condition used to develop the chromatoplates was not the same condition used in this research.
UV-Vis’s Analysis of the Samples
Aqueous solutions of thiamine show a pH-dependent absorption in UV-Vis spectrometry. Spectrometric characteristics of thiamine has been used for structural investigations ad assays of this vitamin in biological and pharmaceutical materials [21]. Figure 11 show the maximum absorption values of thiamine at 192, 233 and 268nm corroborating the reported data from researchers where inform that the compound shows bands at 233-35 and 265- 268nm in aqueous solution at pH 2-3.
After sample degradation with HCl, NaOH and H2O2, the spectrums showed deformation in the bands, shift and overlapping. With HCl a maximum of 196nm and an overlapping of both bands at 246 and 275nm (245nm), indicating that the band at 275nm had a bathochromic shift of 30nm. In NaOH, was observed a single remaining band at 196-197nm, because the rest of them are deformed. With H2O2 the spectrum is completely deformed reason why this result evidence that thiamine is very sensitive to those oxidation-reduction processes implicating the formation of the fluorescent strong blue colored thiochrome (Figure 12).
Chlorobutanol used as preserver showed the same degradations under those chemical degrading substances such is showing in Figure 13. The higher degradation was in front of H2O2. The products from 2013 and 2016 revealed the same degradation under the conditions above mentioned.
HPLC-DAD Analysis of Thiamine and Injectable Solution
The comparison of results among the samples of thiamine from 2013 and 2016 and the finished product in 2017 after de detection by UV-DAD spectroscopy at 245, 255, 265 and 280nm evidenced that the finished product from 2017 was the most degraded product under conditions above mentioned.
As is shown in Figure 14, the product of 2013 suffered the higher degradation after it was submitted to NaOH agent, because no signal was registries that denote the presence of thiamine or degradation products, suggesting that in a strong alkaline means after 24 months of addition of this agent all sign of the sample or its derivatives disappear. Light or no degradations were observed after HCl and peroxide oxide treatment of the sample, only little presence of secondary metabolites were appreciated in the spectrums [22,23].
Degradation of the product from 2016 allow to infer that analyzed compound get a greater degradation under HCl and NaOH, but not with H2O2, being more evident under NaOH (Figure 15).
Finished product degraded in 2017 showed that the degradation process was bigger with NaOH, and thermal degradation (heat at 60 °C), although with H2O2 also provoked degradation with less intensity as is shown in Figure 16.
For the main materials employed in the research degradation assay that had more influence over the samples was the NaOH agent, while to the finished product were the NaOH and thermolisis evidenced by the change in coloration (from transparent to yellow) and the appearance of an unpleasant strong odor. Both situations were more evident in the thermolisis process.
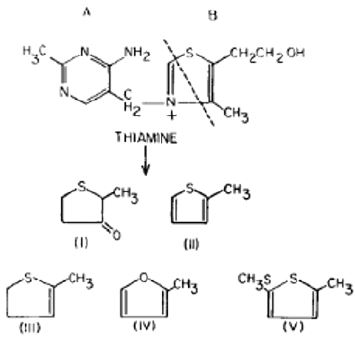
Dwivedi and Arnold, 1972, postulated that a number of thiamine degradation products apparently arise from the 5-carbon fragment B of the thiazole moiety (Figure 17). They believe that the N-C or C-S bond is broken as indicated by the broken line, followed with the rearrangement and cyclization of fragment B. In this process one molecule of hydrogen sulfite or water is eliminated and 5-carbon is cleaved, resulting in the formation of these compounds.
CONCLUSION
The results obtained show that the methodologies used for assessing the chemical stability of Thiamine allow to determine qualitatively the degradation of the samples used in the research. Degradation process that most affected the prime matter, and the finished product were basic hydrolysis and thermolisis, and in less quantity oxidation process. Employed methodology to realize the TLC is novel according with the conditions used since because it was possible to detect the presence of degradation products in the prime matter as much as the finished product.
REFERENCES
- Instituto Valenciano de la Exportación (IVEX CUBA) (2005) Productos farmacéuticos.
- FEUM (2016) Farmacopea de los Estados Unidos Mexicanos, Mexico.
- Kashyap RW, Ponnaiah R, Mitali BS, Srinivasa RK, Vigneshwar R, et al. (2012) Evaluación de impurezas en fármacos. Pharmaceutical Technology en Español 10(3).
- Voelker AL, Taylor LS, Mauer LJ (2021) Effect of pH and concentration on the chemical stability and reaction kinetics of thiamine mononitrate and thiamine chloride hydrochloride in solution. BMC Chemistry 15(1): 47.
- Nath A, Shope T, Koch T (2017) Thiamine (vitamin B1) after weight loss bariatric surgery A2. In: Rajendram R, Martin CR (Eds.), Metabolism and pathophysiology of bariatric surgery. Academic Press, Boston, USA. pp. 479-489.
- US Food & Drug Administration. FDA Vitamins and Minerals Chart.
- McCandless D (2010) Thiamine deficiency and associated clinical disorders. Humana Press, New York, USA. pp. 1-192.
- BP (2013) (British Pharmacopeia). Ph. EUR. Monograph 0303. Version 17.0, p: 1579.
- USP 35 (2012) Farmacopea de los Estados Unidos de América. Monografías Oficiales 3: 5359-5360.
- Mohammad A, Laeeq S (2010) Application of water -in -oil microemulsion chromatographic study of different groups of organic compounds. Scholars Research Library: De Pharma Chemica 2(1): 281-286.
- Williams RJ, Eakin RE, Beerstecher E, Shive W (1950) The biochemistry of vitamins. Reinhold Pub Corpn, New York, USA. p: 684-702.
- Williams RR (1938) Vitamin B and its use in medicine. Macmillan Publishing Co, New York, USA.
- Equihua del TM (2001) Efecto de la Cocarboxilasa sobre la glucemia en ratas Wistar inducidas a diabetes. Tesis en opción del grado de Máster en Ciencias Médicas. Colima, Colombia.
- Connors K (1986) Chemical stability of pharmaceutical. In: A handbook for pharmacists (2nd edn). Wiley-IEEE Press, USA. pp. 237-315.
- Dwivedi BK, Arnold RG (1972) Chemistry of thiamine degradation: Mechanism of thiamine degradation in a model system. Journal of Food Science 37: 886-888.
- Ribeiro OD, Pinto CD, Lima ML, Volpato MN, Cabral ML, et al. (2011) Chemical stability study of vitamins thiamine, riboflavin, pyridoxine and ascorbic acid in parenteral nutrition for neonatal use. Nutrition Journal 10: 47.
- Linton CR, Reynolds MTP, Warner NJ (2002) Using thiamine to reduce post ECT confusion. International Journal of Geriatric Psychiatry 17(2): 189-192.
- Mauril M, Alzamora SM, Tomio JM (1992) Effect of electrolytes on the kinetics of thiamine loss in model systems of high-water activity. Food Chem 45(1): 19-23.
- Díaz SA, Gil SC, Muñoz GP, Herreros TA (2009) Estabilidad de vitaminas en nutrición parenteral. Nutrición Hospitalaria 24 (1): 1-9.
- ICH (2003) International Conference on Harmonization: ICH Q1A: Stability testing of new drug substances and products. Federal Register 68: 65717-65718.
- Moffat AC (1986) Clarke′s Isolation and Identification of Drugs (2nd edn). The Pharmaceutical press, London, UK, pp. 1014-1015.
- Thomas S, Kumar R, Sharma A, Issarani R, Nagori PB (2008) Stabilityindicating HPLC method for determination of vitamins B1, B2, B3 and B6 in pharmaceutical liquid dosage form. Indian Journal of Chemical Technology 15: 598-603.
- Arioglu-Tuncil S, Voelker AL, Taylor LS, Mauer LJ (2020) Amorphization of thiamine chloride hydrochloride: effects of physical state and polymer type on the chemical stability of thiamine in solid dispersions. Int J Mol Sci 21: 5935.
Article Type
Research Article
Publication history
Received Date: February 05, 2022
Published: February 28, 2022
Address for correspondence
José González, Facultad de Eduacación en Ciencias Técnicas, UCP “Enrique José Varona”, Cuba
Copyright
©2022 Open Access Journal of Biomedical Science, All rights reserved. No part of this content may be reproduced or transmitted in any form or by any means as per the standard guidelines of fair use. Open Access Journal of Biomedical Science is licensed under a Creative Commons Attribution 4.0 International License
How to cite this article
Leisy Baró, Odalys Madrazo, Alen N Baeza, José González, Frantz François- Haugrin, Max Monan. Determination by Chromatographic Methods of Degradation Products of Thiamine 100mg Injection. 2022- 4(1) OAJBS.ID.000405.
Figure 1: Chromatograms of both samples (2016 and 2015) after HCl degradation.
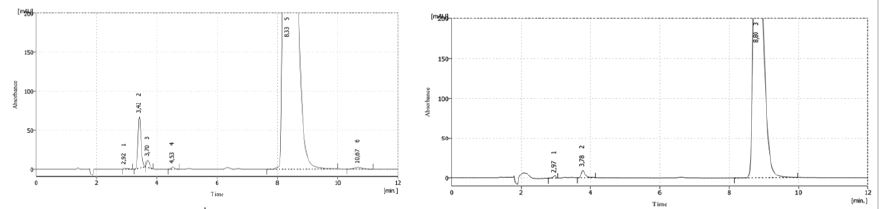
Figure 2: Acid hydrolysis of thiamine.
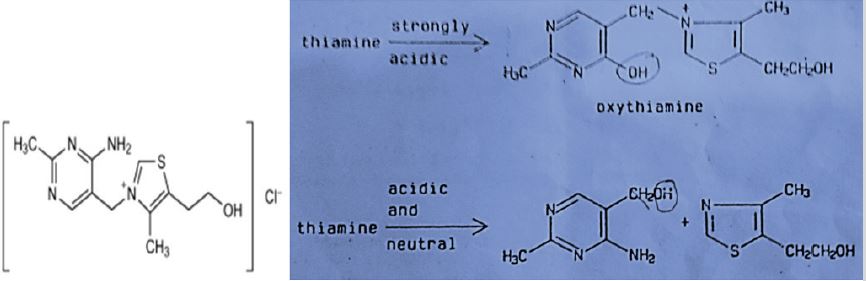
Figure 3: Chromatograms of both samples (2016 and 2015) after NaOH degradation.
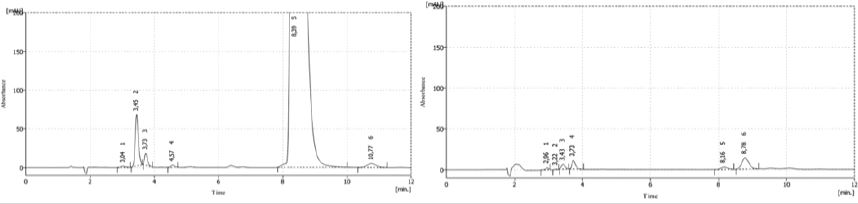
Figure 4: Acid-base equilibrium of thiamine.
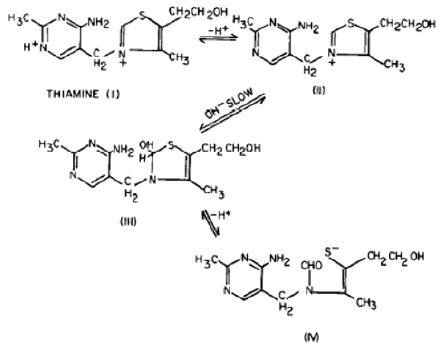
Figure 5: Chromatograms of oxidation process from samples 2016 and 2015, respectively.
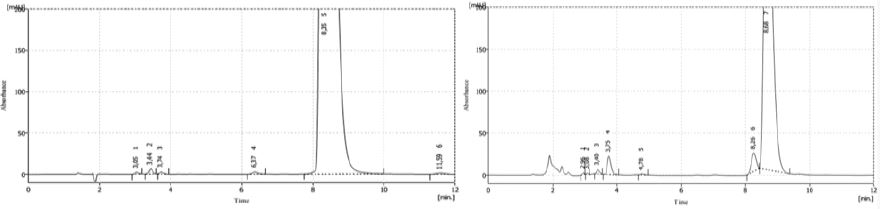
Figure 6: Oxidation of thiamine by oxidizing agents.
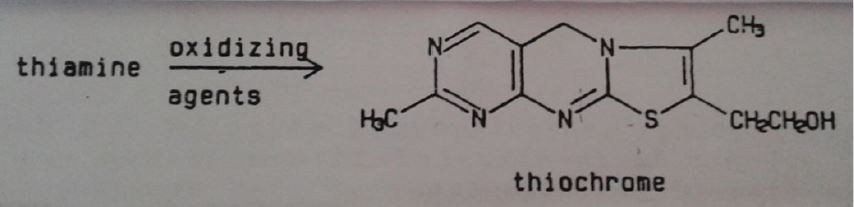
Figure 7: Chromatograms of thermal degradation from placebo and sample T 16003.
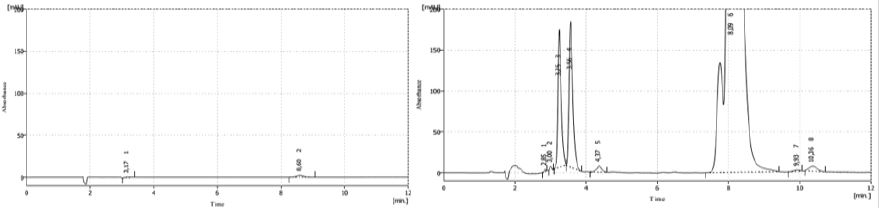
Figure 8: Chromatogram of the finished product under photolysis process.
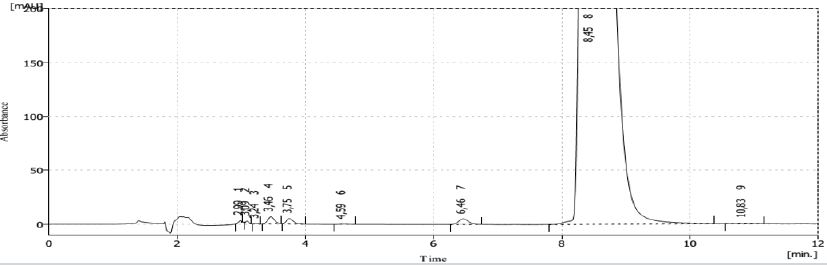
Figure 9: Chromatoplates under UV254 nm.
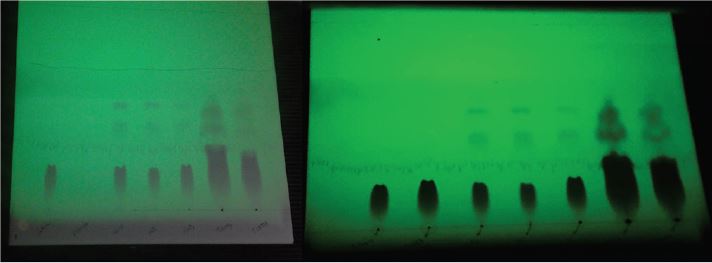
Figure 10: Chromatoplates after iodine exposure.
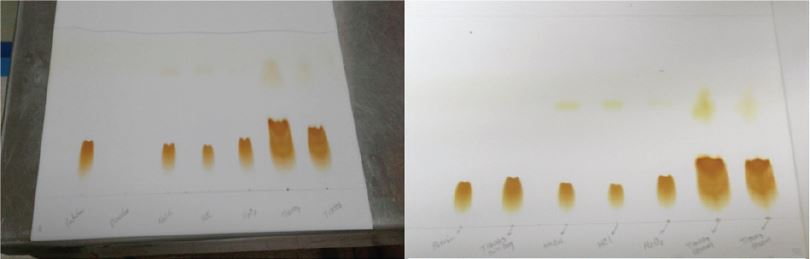
Figure 11: UV spectrum of thiamine in solution (pH 2.9).
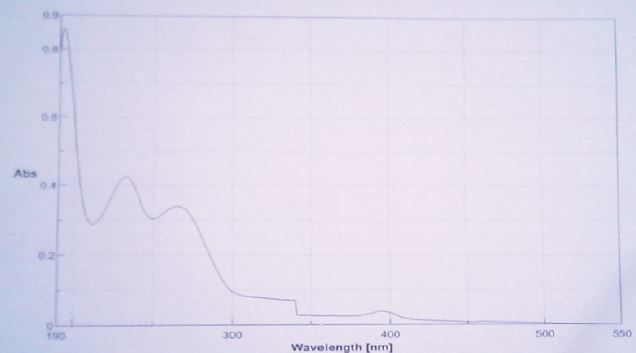
Figure 12: UV spectrums of thiamine after degradation with HCl, NaOH and H2O2.
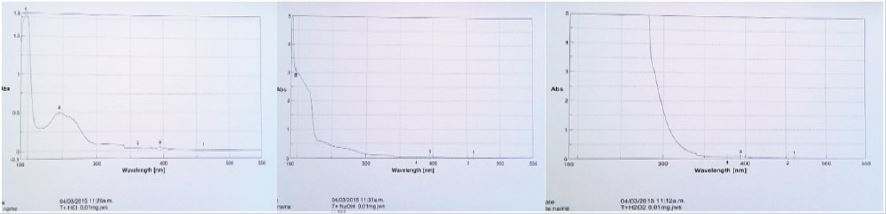
Figure 13: UV spectrums of chlorobutanol under different degrading conditions.
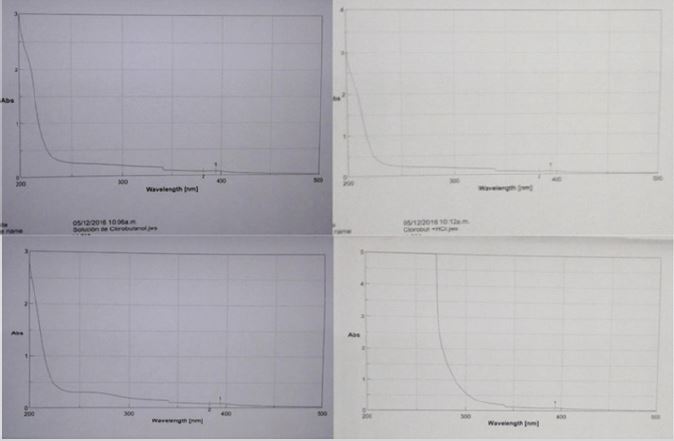
Figure 14: Chromatograms of the product from 2013 under HCl, NaOH and H2O2.
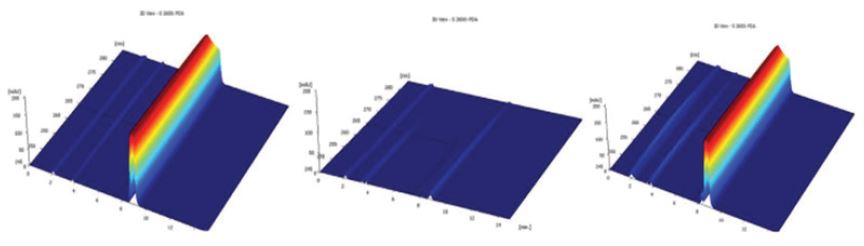
Figure 15: Chromatograms of the product from 2016 under HCl, NaOH and H2O2.
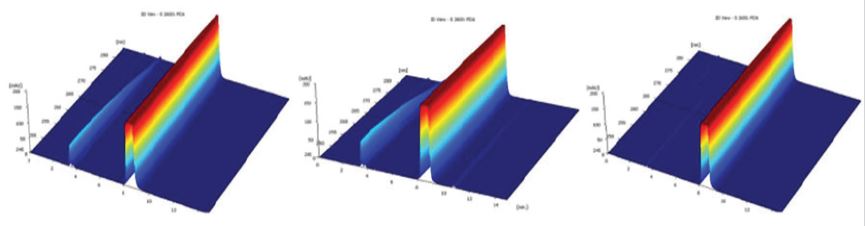
Figure 16: Chromatograms of degradation in 2017 of the finished products from 2016 under different degrading agents (from left to right: finished product without degradation; with HCl; with NaOH; with H2O2; photolysis; thermolisis).
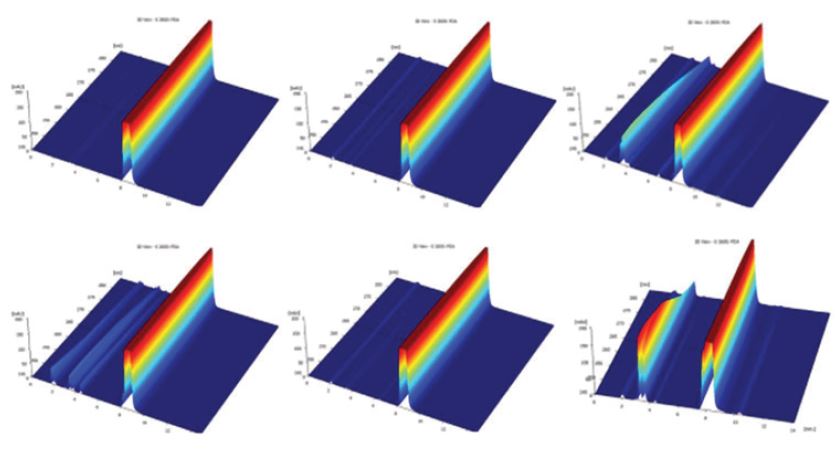
Figure 17: Volatile compounds from heat degraded thiamine..