Changes Over 6 Months of Gut Microbiota and Nutritional Parameters In patients with Alcoholic Liver Disease: A Prospective Study
ABSTRACT
Background/Aims: This prospective longitudinal study described changes in gut microbiota in patients with alcoholic hepatitis
(AH) and alcoholic cirrhosis (AC) and the relationship with clinical parameters.
Methods: Included patients had histologically confirmed AH or AC with a 6-month follow-up (FU). Data were collected at baseline,
3 and 6 months: fecal microbiota, alcohol intake, MELD score and blood tests, body composition, nutritional intake and energy
expenditure. Changes in non-metagenomics data over time were assessed using multiple linear regression. PERMANOVA, DESeq2
and Wilcoxon tests were used for metagenomic comparisons, and DISTLM for correlations between clinical and metagenomic data.
Results: We included 10 AH patients and 12 AC patients. During FU, 6 AH and 4 AC patients became alcohol abstinent. Compared
to AH, AC patients had decreased C-reactive protein (p = 0.009) and serum bilirubin levels (p = 0.002) and MELD score (p = 0.006),
and increased albumin levels (p = 0.002). Overall microbiota profiles differed between groups at baseline (p < 0.001). While only
few taxa changed in abundance in AC patients, AH patients demonstrated a decrease of 20 oral bacteria and an increase of 10 shortchain
fatty acid-producing bacteria. The relationship between abundance of gut microbiota and body weight and muscle mass at
baseline and at 6 months in AC was no more significant after correction for multiple testing.
Conclusion: Baseline microbiota profile differs in AH and AC. Gut dysbiosis changes are limited to AH, without significant
correlation with clinical parameters nor with alcohol intake. Larger studies are needed.
KEYWORDS
Alcoholic liver disease; Alcoholic cirrhosis; Alcoholic hepatitis; Gut microbiota; Longitudinal study; Body composition; Muscle mass; Metagenomics; Clinical study; Liver biopsy
ABBREVIATIONS
ALD: Alcoholic Liver Disease; AH: Alcoholic Hepatitis; AC: Alcoholic Cirrhosis; MELD: Model for End-Stage Liver Disease; BIA: Bioimpedance; BMC: Brachial Mid-Arm Circumference; HVPG: Hepatic Venous Pressure Gradient
LAY SUMMARY
Cross-sectional studies have demonstrated gut dysbiosis in patients with alcoholic liver disease, but changes in fecal microbiota and possible relationship with clinical parameters have not been explored so far. In this prospective longitudinal study, we observe that the overall gut microbiota profile at baseline differs between patients with alcoholic hepatitis and patients with alcoholic cirrhosis. In addition, repeated measurements at 3 and 6 months of follow-up demonstrate that gut dysbiosis changes are limited to patients with AH without significant correlation with clinical parameters nor with alcohol intake.
INTRODUCTION
Alcoholic liver disease (ALD) is the most common cause of chronic liver disease worldwide. ALD refers to a clinical and histologic spectrum including steatosis, cirrhosis (AC) and alcoholic hepatitis (AH). Alcoholic cirrhosis develops in a minority of alcohol drinkers, under the influence of cofactors including obesity, female sex and genetic polymorphisms. Patients with AC may have few symptoms of liver disease, a clinical situation under the name of compensated cirrhosis. Over time and mostly in association with continuous alcohol intoxication, the majority of patients with AC develop manifestations of liver insufficiency and portal hypertension including ascites and variceal bleeding, which corresponds to the state of decompensated cirrhosis. Alcoholic hepatitis (AH) is a clinical entity which is part of the spectrum of ALD and may present with varying degree of severity. Patients with severe AH come to medical attention with jaundice of recent onset in association with signs of liver insufficiency in the setting of heavy alcohol intake [1].
As AC often coexist with AH, at least in the Western world, both acute inflammatory liver disease and complications of cirrhosis contribute to the poor outcome of these patients. Alterations in gut microbiota (or gut dysbiosis) is reported in cirrhosis [2]and in ALD in particular [3]. Reduced intestinal levels of Akkermansia muciniphila and Faecalibacterium prausnitzii, and higher levels of Enterobacteriaceae are reported in patients with heavy alcohol consumption as compared to healthy controls [4]. Cross-sectional studies described alterations of fecal microbiota in patients with ALD as compared to heavy drinkers without ALD [5]. The relationship between alcohol consumption, gut dysbiosis and mechanisms contributing to emergence of ALD has been recently reviewed [3,6]. Recently, attention has also focused on the role of gut microbiota as a cofactor on the risk to develop ALD [7] as well as a modulator of intestinal wall integrity and permeability during exposition to alcohol [8]. A relationship between gut microbiota and nutritional status (body weight and composition) has been described in non- liver related clinical setting [9], but not in patients with chronic liver diseases. In addition, whether any changes occur in gut dysbiosis and nutritional status during follow-up has not been explored so far in ALD. Thus, this prospective longitudinal study over 6 months aimed at describing 1) the evolution of clinical, laboratory and nutritional parameters in patients with ALD, and 2) the possible changes of fecal microbiota in patients with ALD, and the correlations with the clinical parameters. Provided that patients with AH and AC differed clinically and biologically at baseline, we speculated that the evolution over time would be different between groups and may translate into different changes in gut microbiota.
MATERIALS AND METHODS
Study Population
This prospective longitudinal study considered for inclusion all adults referred to the University Hospital of Geneva for a liver biopsy in the context of a suspected or proven ALD, between January 2014 and March 2018. All patients were hospitalized with a suspected diagnosis of AH or AC based on well accepted clinical signs and liver histology. The patients were excluded if they presented one of the following conditions: viral hepatitis, HIV infection, pregnancy, history of liver transplantation, hepatocellular or any other active cancer, cholestatic liver disease, inflammatory bowel disease, hepatic encephalopathy precluding an informed consent, recent (<4 weeks) gastro-intestinal bleeding, sepsis, exposure to antibiotics in the previous 4 weeks, and age > 75 years. The study was approved by the local Ethics Committee (Projet N°PB_2016-02017, Protocole d’Etude Clinique 13-097, Commission Cantonale d’éthique de la Recherche de Genève) and all patients signed an informed consent.
DATA COLLECTION
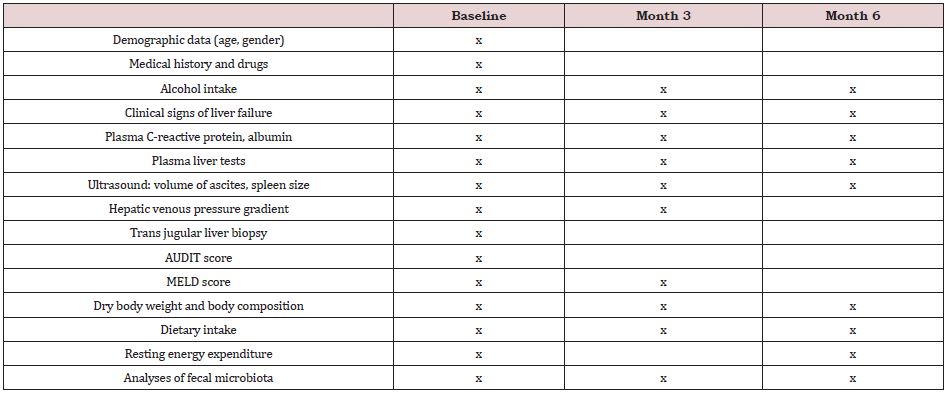
The patients were followed for 6 months after inclusion and underwent 3 study visits altogether, i.e. at baseline (before the liver biopsy, T0), and at month 3 (T3) and 6 (T6). The data collected at each visit are shown in Supplemental Table 1. The following data were obtained: age, sex, medical history (hyperlipidemia, pancreatitis, smoking status), drugs, daily alcohol consumption, clinical signs of liver failure (ascites, jaundice), blood tests (C-reactive protein, albumin, and total bilirubin), ultrasound-assessed ascites and spleen size, and hepatic venous pressure gradient (HVPG) measured during transjugular liver biopsy, as reported [10]. The severity of the liver disease and of the alcohol dependence were assessed by scores and questionnaires, as detailed below. The data collected for the purpose of this research included also body composition, dietary intake and resting energy expenditure, and analyses of the fecal microbiota composition. Patients with biopsy confirmed severe AH and a Maddrey score > 32 at baseline were treated with corticosteroids. Corticosteroids were discontinued at day 7 in nonresponders, as assessed by the Lille score [11].
Scores and Questionnaires
The severity of the liver disease was assessed by the MELD score [12]. The Alcohol Use Disorders Identification Test (AUDIT) was carried out to determine the quantity and pattern of alcohol consumption [13]. The total score ranges from 0 to 40 and a score ≥ 8 indicates an alcohol use disorder.
Weight and Body Composition
We measured body weight in light clothes without shoes on a calibrated electronic scale, and body height with a height gauge. We estimated the volume of ascites by ultrasound on the same day to obtain the dry body weight. Mid-arm circumference of the nondominant arm was measured with a flexible non-extensible plastic tape to the nearest 0.1 cm. We assessed thrice the tricipital skinfold thickness of the non-dominant arm and recorded the average value. Brachial muscle circumference (BMC) was calculated with the following formula: BMC (mm) = mid-arm circumference (mm) – (3.14*tricipital skin fold thickness (mm)). We assessed the wholebody composition by tetrapolar bioelectrical impedance analysis (BIA; Nutriguard®, Datainput GmbH) as described elsewhere [14]. We recorded resistance and reactance which allowed to calculate fat-free mass by the Geneva formula [15]. The fat mass was obtained by subtracting the fat-free mass from the body weight. The fat-free and fat masses were divided by height in order to obtain the fat-free mass index and the fat mass index, which allows the comparisons of patients with different statures. We also recorded phase angle, a raw BIA parameter which reflects the cell size and cell membrane integrity [16]. A low phase angle has been associated with mortality in patients with liver cirrhosis [17].
Dietary Intake and Energy Expenditure
A senior dietician (V.L.K., V.V.) assessed the total calorie, protein, carbohydrate and fiber intake by a 24-hour dietary recall, without taking into account alcohol intake. Nutritional advice and support were given when necessary as part of routine care. The interview with the patient took place several days after hospital admission while the patient was in a stable condition. We measured resting energy expenditure by indirect calorimetry (Deltatrac®, Datex, Finland) according to the manufacturer’s procedure. Measurements (V.L.K., V.V.) were performed over 20 to 25 minutes after an overnight fast and at least 15 minutes bedrest. For each patient, we reported mean VO2, VCO2, the respiratory quotient (VCO2/VO2) and the energy expenditure.
Metagenomics Sampling and Analysis
Stool sample collection: The patient collected a nut-sized section of feces in a 30-mL polypropylene container, at baseline, month 3 and month 6. If the patient was hospitalized, the sample was immediately transported to the lab. If the patient was at home, it was transported within 2 hours to the lab. In the lab, the stool samples were frozen and stored at –80°C until processing.
DNA extraction from stool samples and sequencing: DNA was extracted from 100 mg stool samples using Quick-DNA Fecal/Soil Microbe Miniprep Kit (Zymo Research) according to the manufacturer’s recommendations. In this protocol, cells were disrupted by a 20-min bead beating at maximum speed on a Vortex-Genie 2 (Scientific Industries) with horizontal tube folder and eluted in 55 μL of H2O. Three negative extraction controls were performed by extracting DNA using the same procedure but omitting the addition of a stool sample, which was replaced by 100 μL of BashingBead buffer. Purified DNA was quantified by Qubit dsDNA BR Assay Kit (Thermo Fisher Scientific) and stored at – 20 °C. DNA libraries were prepared with the NextSeq 500 High Output v2 Kit (Illumina) and sequenced (2×150) on a NextSeq 500 (Illumina) at LGC Genomics GmbH (Berlin, Germany).
Pre-processing, taxonomic classification and relative abundance computation: The overall quality of raw reads was inspected with the FastQC tool (http://www.bioinformatics. babraham.ac.uk/projects/fastqc/). Raw reads were adaptertrimmed and quality-filtered with Trimmomatic v0.36 [18] (SLIDINGWINDOW:20:28 MINLEN:100 LEADING:11 TRAILING:11). Replicate reads were removed with in-house perl scripts (https:// github.com/GRL-HUG/duplicates v.2) and dereplicated reads were mapped against human genome assembly (GRCh38.p13) using CLARK v.1.2.6.1 (- m 0 -P) [19]. Host-depleted reads were assigned to microorganisms (bacteria, archaea, viruses and microeukaryotes) by MetaPhlAn 3 (v.3.0.1) [20] with default parameters. For detection of fungi and viruses, we also performed k-mer-based read classification using Kraken 2 (--paired --confidence 0.1) [21], which has higher sensitivity than MetaPhlAn3 read mapping to taxonomic markers. For that purpose, from the host-depleted sequence dataset, we removed low-complexity reads using Komplexity (--threshold 0.5 --filter) [22] and classified remaining read pairs sequentially against three custom databases built from Latest RefSeq assemblies (downloaded on 17 February 2022). The reads that remained unclassified after performing one round of the Kraken 2 analysis were used as input for the next round. The custom databases were respectively built of: (i) bacterial reference, representative, completely sequenced and Bacteria Candidate Phyla genomes (n = 33000); (ii) archaeal reference, representative and completely sequenced genomes (n = 599); fungal genomes (n = 420); genomes of human protozoan parasites (n = 21; names were compiled from https://wikipedia.org/wiki/List_of_parasites_of_ humans); and genomes of DNA viruses from the genera that infect humans (names of which were compiled from viralzone.expasy. org) (n = 652); (iii) genomes of DNA prokaryotic viruses (names of which were compiled from viralzone.expasy.org) (n = 4588). From the Kraken 2 output, we reestimated taxa abundance using Bracken [23]. Viral and fungal read counts were normalized per million prokaryote- assigned reads. To profile microbial metabolic pathways, we used HUMAnN 3 (v 3.0) [24] with default parameters and UniRef 90 database, starting from pooled forward and reverse reads of host-depleted read pairs. From the pathabundance output table we normalized gene copies per million rieads (CPM) using the human_renorm_table tool.
Statistical analyses: For the statistical analyses, only the patients who achieved the 6 months follow-up and had complete data on fecal microbiota were included in the analyses.
Non metagenomic data: Non metagenomic data were analyzed with Stata Release 16.1. The normality of the data distribution was tested with Shapiro–Wilks tests. Categorical variables were expressed as numbers (percentages), and continuous variables as median (interquartile range) since they were not normally distributed. Comparisons between groups at baseline were performed by the Mann– Whitney U test for continuous variables, and Fisher’s exact test for categorical variables. Correction for multiple testing was performed using the Benjamini–Hochberg procedure. The evolution of the continuous data over the 6 months was analyzed by multiple mixed linear regression models and we reported for each model the coefficient, the 95% confidence interval (CI) and the associated p-value. The evolution of binary variable was assessed with multilevel mixed-effects logistic regression. The models evaluated whether the changes of the measured parameters could be predicted by disease (AC vs. AH) and the study visit number, without and with interactions. The impact of alcohol abstinence could not be analyzed in AC and AH patients separately in view of the low sample size.
Metagenomic data: Variations in microbiota structure between groups of patients and longitudinally within individuals of a given group were assessed based on Bray-Curtis dissimilarity matrix generated with the vegdist function of the vegan v2.5- 7 package in R v4.1.1 from square-root-transformed relative abundance of species. To visualize differences in microbiota profiles between different groups of samples, we used non-metric multidimensional scaling (NMDS) generated with metaMDS function in vegan. The envfit function from the vegan package was used with 9,999 permutations to fit the species relative abundance to overall bacterial community in NMDS. The differences of microbiota between AH and AC patients and between visits in each group were tested using PERMANOVA test implemented in the adonis function of the vegan package, with 9,999 permutations. Alpha-diversity variations were explored using Shannon diversity index calculated in vegan with the diversity function, and statistically tested with Wilcoxon signed- rank (paired) or Mann–Whitney U test. To calculate Shannon diversity index, the counts of species-level classified reads in the MetaPhlAn3 bowtie2 output were rarefied to the lowest number (n = 34,438) of any sample using linux command shuf. Rarefied data were input into MetaPhlAn3 again and resulting species relative abundances were used to calculate the Shannon index. To assess the statistical significance of differences in the relative abundance of individual taxa (from MetaPhlAn3 counts generated with the option –t rel_ab_w_read_stats) and metabolic pathways (from HUMAnN pathabundance output table) according to different factors (e.g. baseline disease or sampling point), we used DESeq2 [25] after filtering out taxa found in less than 25% of the compared samples. When comparing between different timepoints, models were adjusted considering patients. A Benjamini-Hochberg corrected p-value < 0.05 of the DESeq2 output was considered significant. The significance of differences in fungal and viral reads (normalized to million bacterial reads) was assessed by Mann–Whitney U and Wilcoxon signed- rank tests. The association between microbiota and quantitative study parameters was tested using distance-based linear model (DISTLM), with 9,999 permutations in PRIMER v7 (PRIMER-E Ltd, Plymouth, UK). p values obtained by Mann–Whitney U, Wilcoxon signed-rank and DISTLM tests were corrected for multiple comparisons using the Benjamini–Hochberg procedure with the p.adjust function from the stat package in R. Quality-filtered dereplicated non-human reads are available on European Nucleotide Archive Database under the study accession number PRJEB51056.
RESULTS
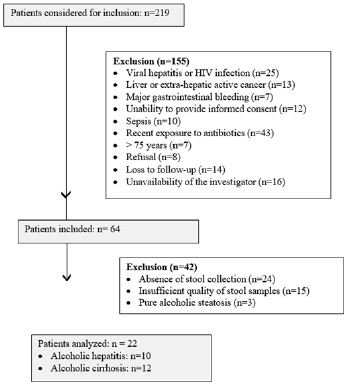
The flow chart of the study is shown in Supplemental Figure 1. After exclusion of patients with missing fecal microbiota or non-interpretable samples due to recent exposure to antibiotics, twenty-five ALD patients completed the follow-up of 6 months, i.e three patients with alchohol steatosis, 10 patients with AH and 12 patients with AC. The low number of patients with steatosis precluded any group comparison and they were therefore excluded from further analyses, to obtain a final number of 22 analyzable patients.
Non-Metagenomic Data
Baseline data and comparisons: The baseline comparisons of AC and AH patients are shown in Table 1. As compared to the AC patients, the AH patients had significantly higher levels of C-reactive protein and total bilirubin but lower levels of albumin, as well as a higher HVPG and MELD score. With regards to the nutritional state, one AC patient had a body mass index < 18.5 kg/ m2, and seven patients (3 AH and 4 AC patients) had a low muscle mass, defined as fat-free mass index < 17 kg/m2 in men and < 15 kg/m2 in women [26].
Longitudinal data and changes: Five out of 10 AH patients received steroids and 3 of them qualified as responders. During follow-up, 3 patients, all with AH, received oral nutritional supplements. Six AH patients and 4 AC patients became completely abstinent of alcohol. The study parameters at months 3 and 6 visits are shown in the Supplemental Table 2.
Compared to the patients who continued drinking alcohol, the AH patients who became abstinent were younger (49.0 (40.0–53.0) vs. 59.9 (56.5–63.0) yrs, p=0.010), and, at baseline, had a higher baseline calorie (27.9 (19.8–31.2) vs. 9.6 (6.5-14.8) kcal/kg/d, p=0.019), protein (0.9 (0.7–1.3) vs. 0.2 (0.1–0.3) g/kg/d, p=0.011) and fiber (11.5 (9.0–16.0) vs. 2.0 (0–5.0 g/d, p=0.010) intake as well as a higher phase angle value (p=0.013).
The AC patients who became abstinent had a lower baseline body weight (56.0 (47.9– 65.8) vs. 80.3 (66.5–83.5) kg, p=0.033), body mass index (21.4 (19.1–23.4) vs. 27.4 (22.4–27.9) kg/m2, p=0.008) and resting energy expenditure (p=0.038) than the nonabstinent AC patients.
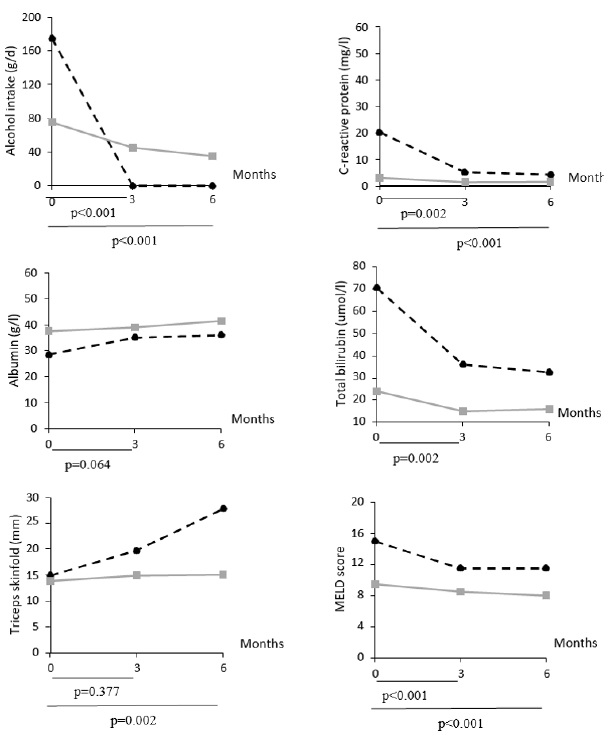
In the multiple mixed linear regression models, after correction for multiple testing (Table 2), AC patients experienced a decrease of C-reactive protein and total bilirubin, HVPG, MELD score, and an increase of albumin levels, compared to AH patients. Interactions between group (AH vs. AC) and study visit number were significant for alcohol intake, C-reactive protein, albumin, total bilirubin, triceps skinfold, MELD score (Supplemental Figure 2), as well as for the presence of ultrasound-assessed ascites (month 3 vs. baseline: p=0.029).
Metatagenomic data: In total, we sequenced 65 samples from 22 patients, i.e. 12 with AC and 10 with AH, with a mean number of 8.2 M (range 0.7–38.8 M) quality-filtered read pairs per sample. In total, 453 species (median 82, range 15–149 per sample) were identified in stool samples.
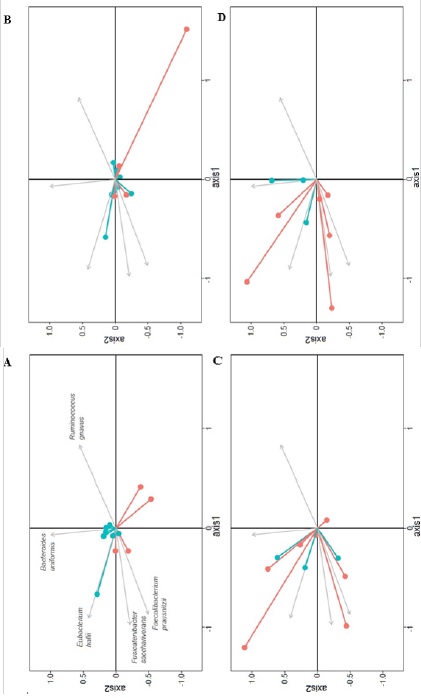
Overall microbiota similarity between and within AH and AC patients: At baseline, bacterial communities were markedly different between AH and AC patients (Figure 1A). The NMDS plot, based on the relative abundance of bacterial species, showed different baseline AC and AH microbiota, with only one AC sample found in the AH cluster and two AH samples located in the AC cluster. The PERMANOVA test confirmed the significant difference in bacterial communities at baseline (p<0.001). At months 3 and 6, the fecal microbiota was not significantly different between AH and AC patients (PERMANOVA test, p=0.142 and p=0.390, respectively) (Figure 1B, 1C). The Bray-Curtis dissimilarity index between AH and AC patients was significantly higher at T0 than T3 and T6 (Figure 1D).
The fecal microbiota did not change significantly at month 3 and 6 relative to baseline in AH (p=0.135 and p=0.101, respectively) and AC patients (p=0.999 and p=0.982, respectively), according to the PERMANOVA test. However, NMDS plots demonstrated relatively similar bacterial community shifts over time among AH but not among AC patients. These temporal changes were generally less pronounced in non-abstinent than in abstinent patients, whether considering AC or AH patients (Supplemental Figure 3).
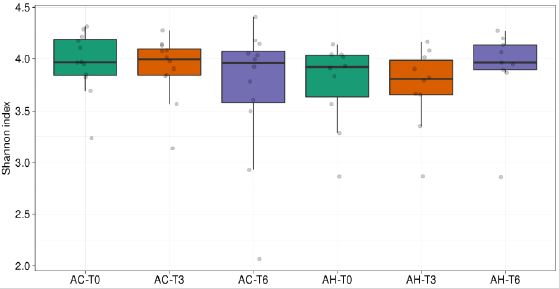
Shannon species diversity decreased slightly but significantly over time in AC patients. The increase in median bacterial diversity observed during the follow-up in AH patients was not statistically significant (Supplemental Figure 4).
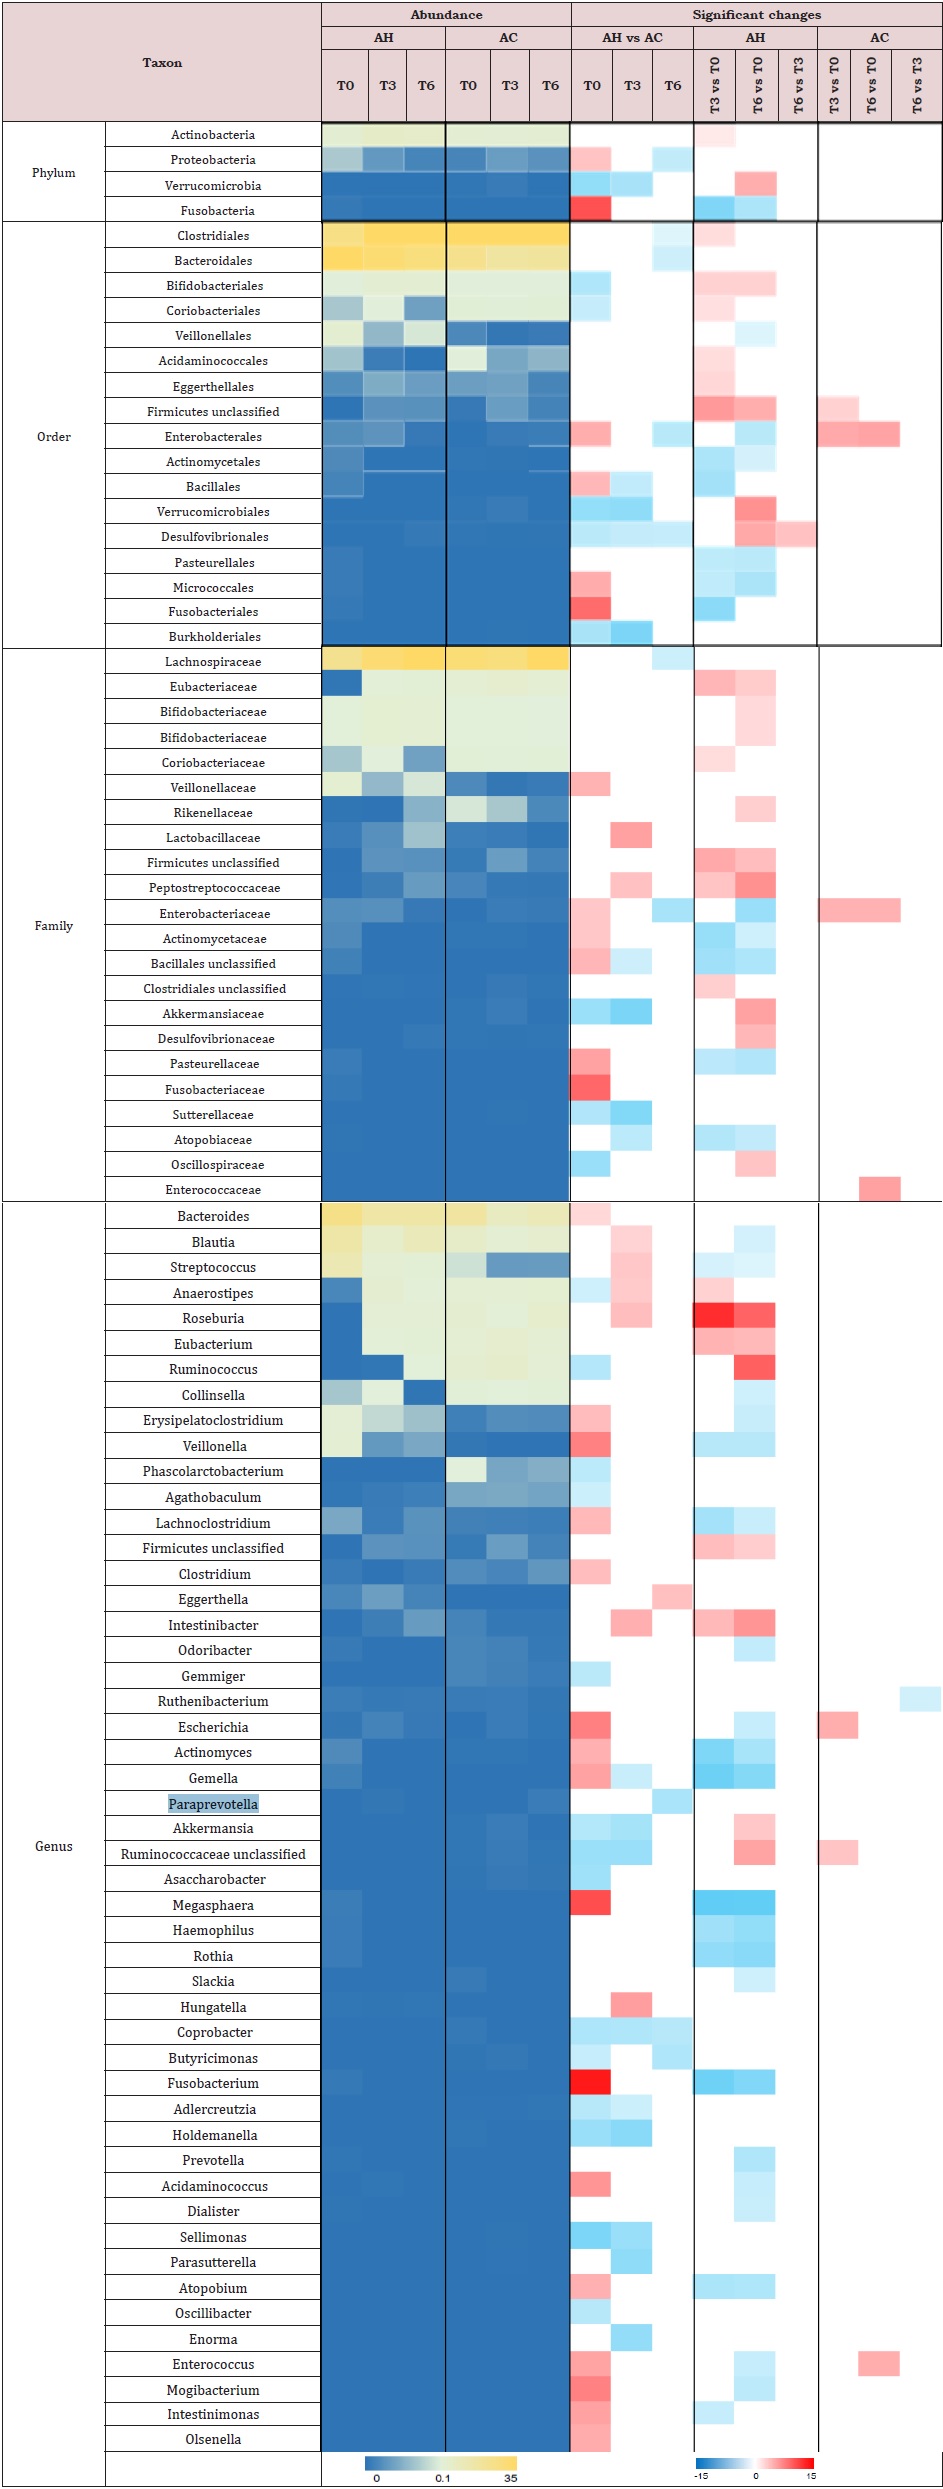
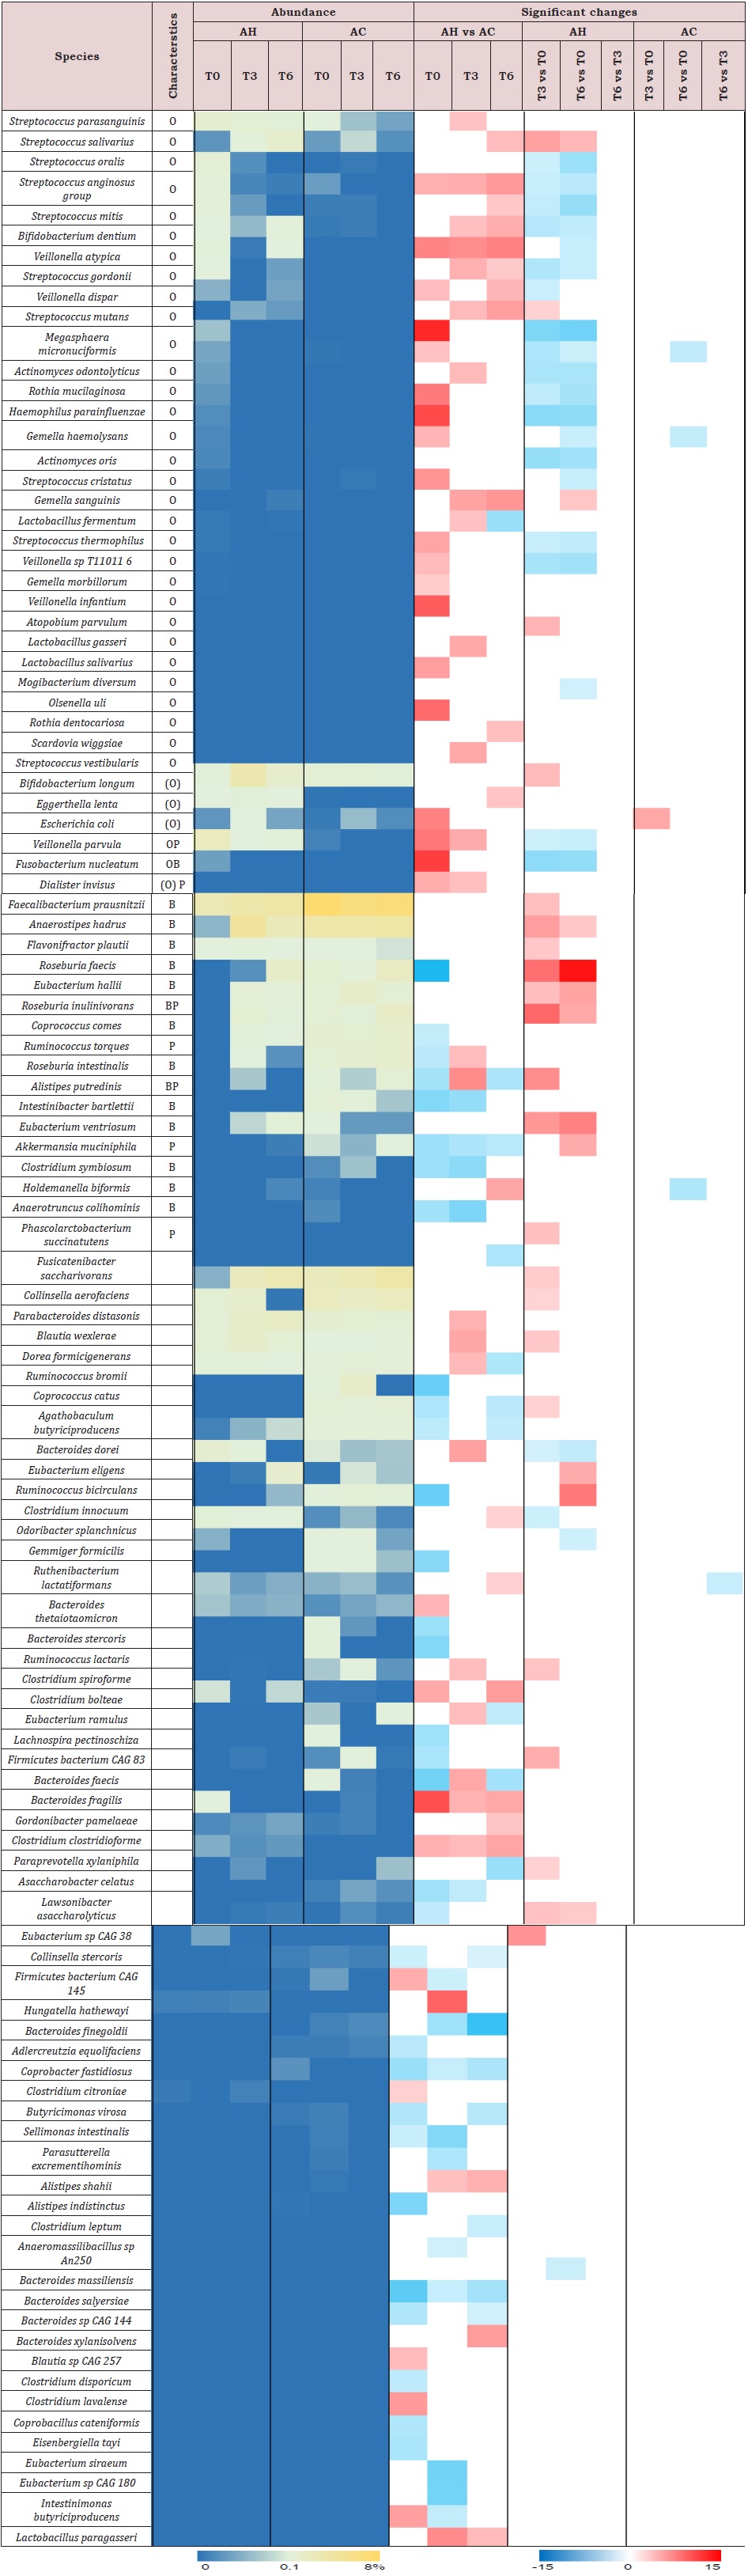
Taxa differences between AH and AC patients: At baseline, we observed an increased relative abundance of Proteobacteria and Fusobacteria phyla (Supplemental Table 3), and Enterobacteriaceae and Veillonellaceae families in AH patients compared to AC patients. Seventeen species typically found in the oral microbiome [27] were significantly higher, while 8 non-oral short-chain fatty acid (SCFA)- producers were significantly lower in AH than in AC samples (Supplemental Table 4). Cumulative abundance of oral-like species in AH patients at baseline was significantly higher than that found at T3 as well as that of AC patients at baseline (Figure 2).
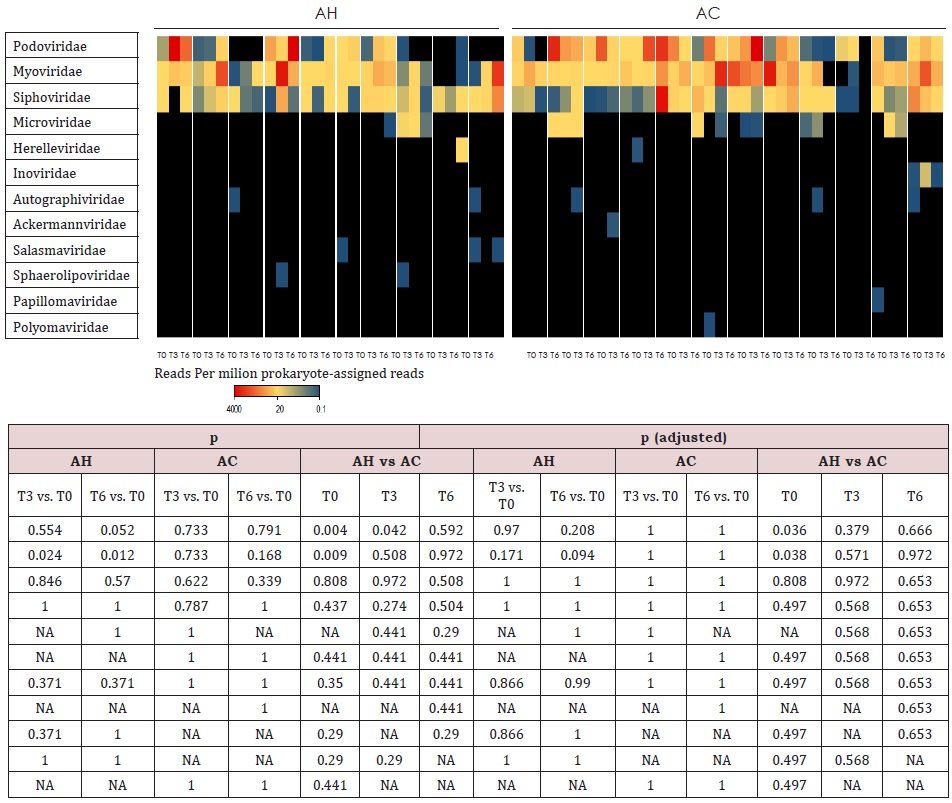
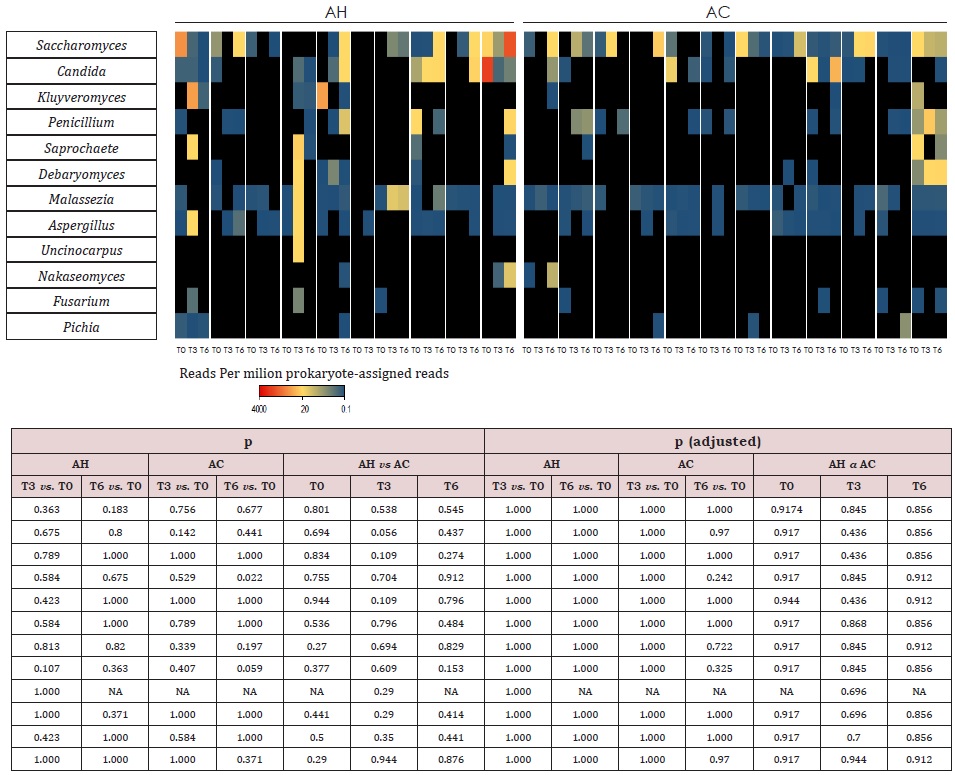
Comparisons of follow-ups to baseline samples within individuals identified 51 differentially abundant species (Supplemental Table 4). In AH patients, 20 oral-like species significantly decreased in abundance during follow-up and only 4 such species increased. In the same patients, 10 non-oral-like SCFA-producing bacteria increased in abundance at month 3 and/ or month 6 as compared to baseline levels. In contrast, very few species changed significantly with time in AC patients. MetaPhlAn3 analysis reported only bacteria and archaea in 93% of samples. In the remaining 7% of samples, fungi were detected at <0.5%. Therefore, we performed Kraken 2 [21] analysis to increase the sensitivity of the detection of viruses and fungi. Metagenomic reads corresponding to viruses and fungi had low counts as compared to bacterial ones. Among viruses, the most abundant were those infecting bacteria (bacteriophages). In AC patients at baseline, median abundances of Podoviridae and Myoviridae (supplemental Table 5) were, respectively, 50-fold and 6-fold those of AH patients. During the follow-up, the abundance of Myoviridae increased in AH patients but the significance of these changes disappeared after correction for multiple testings. No significant changes were observed in the abundance of fungal genera (Supplemental Table 6) over time or between AH and AC groups.
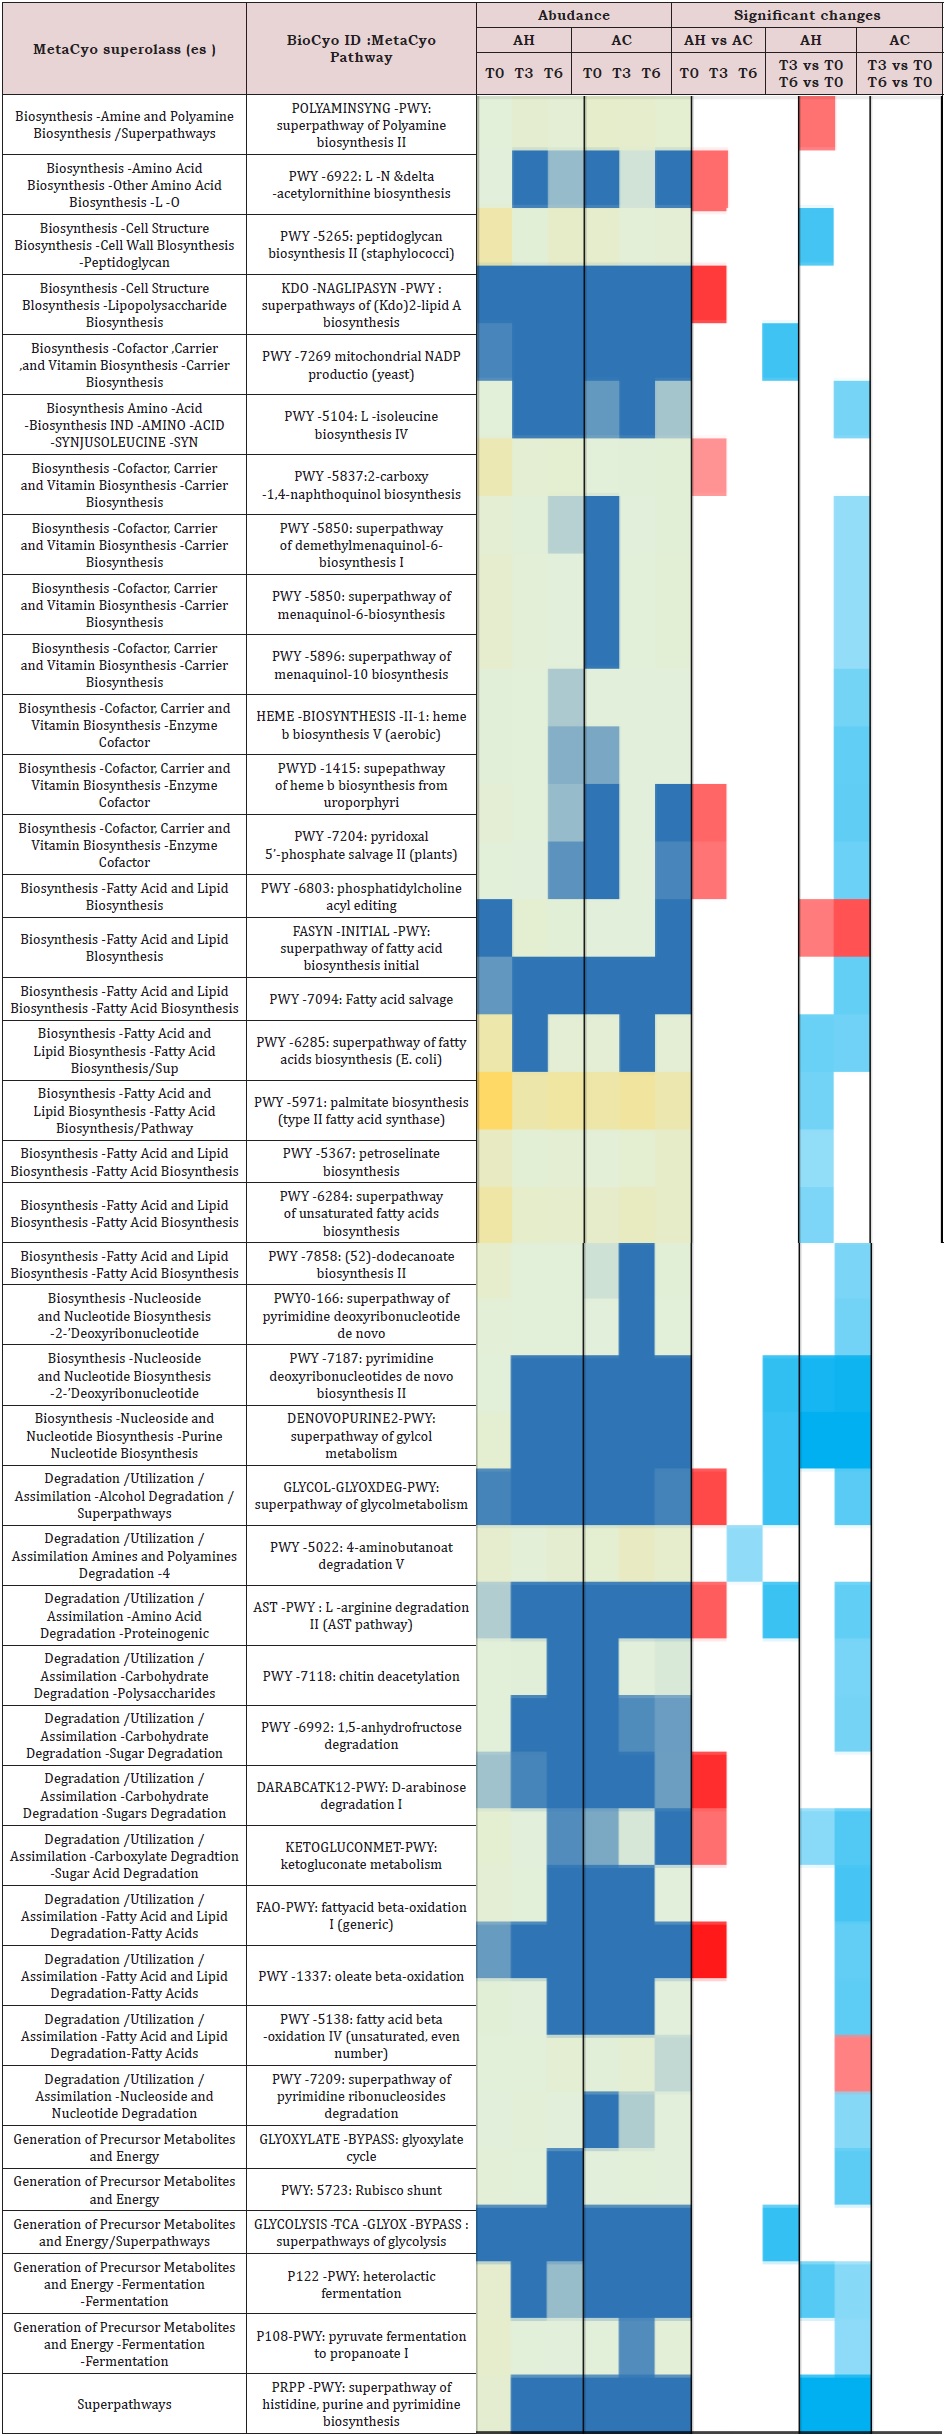
Regarding the metabolic pathways, most of the significant differences between the AH and AC groups were observed at baseline (Supplemental Table 7). Ten pathways were enriched in the AH as compared to the AC microbiota and six of them were significantly reduced when AH T6 samples were compared to baseline [28]. Of these, two belonged to biosynthetic (vitamin and lipid) and four to degradation (glycol, L-arginine, sugar derivative, fatty acid) pathways.
The associations of gut microbiota with quantitative clinical parameters are shown in Table 3. The AC microbiota was associated with body weight, body mass index, brachial muscle circumference, fat-free mass index, and resting energy expenditure at baseline and month 6, while the AH microbiota was associated with phase angle value at month 3 and 6 visits. After correction for multiple testing, microbiota was no more associated with any parameters.
DISCUSSION
This is the first study exploring in detail the changes in gut microbiota in patients with ALD during a follow-up period of 6 months, together with a number of clinical parameters and markers of nutritional state. Few gut bacterial taxa changed with time in the AC group, but several oral and SCFA-producing species changed in abundance in AH patients. The gut microbiota profile was associated with body weight and markers of muscle mass at baseline and month 6 visit in AC patients, but the significance of this association disappeared after correction for multiple testing.
Non Metagenomic Data
As expected, AH patients had higher CRP and total bilirubin, but lower albumin compared to AC patients, at baseline. These values improved with time, likely in response to acute treatments of AH, such as corticosteroids.
At baseline, our patients had low nutritional intakes compared to recommandations of at least 35 kcal/d and 1.2–1.5 g protein/d in non-obese patients with ALD [29]. This confirms previous findings of low energy intake from fat and carbohydrate in heavy alcohol drinkers [30,31]. Poor intakes could be related to unbalanced diets rich in alcohol or digestive symptoms in relation with ascites [32]. It was previously reported that the calorie intake decreases as severity of liver disease increases [33]. In our study, the calorie intake over time did not change, but the severity of liver disease neither. Body weight and fat-free mass have been shown to be lower in alcohol drinkers than control subjects [34]. A prospective study included 105 hospitalized alcoholics with an alcohol intake above 150 g/d over 5 years [35]. During follow-up, those who continued drinking lost lean mass, while those who became abstinent gained lean mass. In our study, 32% of the patients had a low fat-free mass at inclusion, and body composition did not differ significantly between AH and AC patients during follow-up.
Metatagenomic Data
Several studies compared the gut microbiota composition between AC, AH or ALD patients, with or without ongoing alcohol consumption, and healthy controls but none of them compared specifically AH and AC patients [5]. We found higher levels of many typical oral bacteria at baseline in AH patients compared to AC patients. Our results are in line with other studies reporting an enrichment of oral-like bacteria in the gut of AC patients [36,37] or higher levels of Veillonella in AH patients than in controls or patients with less severe AH [38,39]. We also found an increased abundance of Proteobacteria and Fusobacteria phyla, and Enterobacteriaceae and Veillonellaceae families in AH compared to AC patients. As these taxa have been reported to be increased in cirrhotic patients [40], our data suggest further enrichment when cirrhosis is associated with AH. Puri et al. [41] showed that Fusobacteria were increased in the presence of alcohol consumption, independently of the presence or absence of liver disease. Translocation of oral bacteria into the intestinal tract may be due to altered production of bile acids, reduced intestinal motility, impaired mucosal immunity and decreased gastric acid secretion by medication [42].
The abundance of 8 non-oral-like SCFA-producing bacteria was lower in the AH than AC patients, at baseline. Low levels of SCFA producing bacteria as Lachnospiraceae or Ruminococcaceae, were described in AC patients with alcohol dependence [43] or infections [44], and in AH patients [45]. Interestingly, our AH patients had higher levels of C-reactive protein at baseline, which may suggest an inverse association between inflammation and SCFA- producing bacteria. The lower abundance of Akkermansia in AH than AC patients concurs with other studies comparing AH patients and healthy controls [39,46]. Grander et al. [46] highlighted ina murine model that ethanol feeding promotes the depletion of this bacteria and increases gut permeability which could be counteracted by A. muciniphila supplementation.
The overall microbiota composition was not different at month 3 and 6 visits between the AH and AC patients. Very few species changed with time in AC patients, as in another longitudinal study including patients with stable liver disease [44]. However, in AH patients, many oral species decreased including Fusobacterium nucleatum or Veillonella parvula, and 10 non-oral SCFA-producers increased, like Faecalibacterium prausnitzii. These changes could be influenced by factors including alcohol consumption. Accordingly, alcohol is a strong modulator of gut microbiota profiles [47] in patients with or without ALD [43,48]. In our study, we observed a smaller shift in bacterial community in non-abstinent vs. abstinent patients, especially in the AH group, suggesting an influence of alcohol abstinence on the gut microbiota. We did not find any worsening of liver disease in our study population, but Bajaj et al. [44] demonstrated an association between low levels of SCFAproducing taxa and concomitant overgrowth of pathogens, as well as endotoxemia and disease progression.
In addition to changes in bacterial communities, the abundance of bacteriophages differed between AC and AH patients at baseline. A previous study showed a higher abundance of Candida species in alcohol-dependent patients as compared to healthy controls [49]. However, in our patients, fungal communities were similar in AH and AC groups. Compared to AC patients, fecal microbiota of our AH patients was enriched in diverse biosynthetic and degradation pathways, which presumably reflects changes in taxonomic structure. Compared to controls, Chen et al. [50] found alterations in genes involved in nutrient metabolism in AC patients, as for instance a depletion of genes involved in amino acids, bile salts and SCFA metabolism and an enrichment of xenobiotic degradation genes. Dubinkina et al. [36] described upregulations in pathways involved in alcohol metabolism and inflammation in AC patients compared to alcohol dependent patients. Differences in changes in functional potential of the microbiota associated with AC observed across studies may be due to methodological biases and differences in patients’ characteristics. In our population of AH and AC patients, no correlation could be made between clinical parameters and changes in gut microbiota after correction for multiple testing. Whether this relates to the small number of patients studies, or a relatively short follow-up period remains a possible hypothesis.
Strengths and Limitations
The strength of this study is the inclusion of a well characterized population of patients with different forms of ALD, who underwent a close follow-up during several months. This longitudinal study assessing changes in gut microbiota together with clinical, biological and nutritional parameters has not been performed previously. However, we acknowledge that the small number of patients precludes the analysis of the impact of alcohol per se, and the absence of a control group to compare gut microbiota with healthy subjects. In addition, we could not control for dynamic parameters that may influence gut microbiota including drugs, complications of ALD, nutritional intakes or nutritional state in details.
CONCLUSION
The microbiota profile is different between AH and AC patients at baseline. In AH patients, the abundance of several oral and SCFAproducing bacteria decreased and increased over time, respectively, suggesting a reduction of dysbiosis. The changes in fecal microbiota were not significantly correlated to clinical parameters. Larger studies should confirm these differences while taking into account alcohol consumption and could possibly demonstrate a relationship between changes of gut microbiota and clinical outcome.
REFERENCES
- Liver EAS (2018) EASL Clinical practice guidelines: Management of alcohol-related liver disease. J Hepatol 69(1): 154-181.
- Usami M, Miyoshi M, Yamashita H (2015) Gut microbiota and host metabolism in liver cirrhosis. World J Gastroenterol 21(41):11597- 11608.
- Bajaj JS (2019) Alcohol, liver disease and the gut microbiota. Nat Rev Gastro Hepat 16(4): 235-246.
- Litwinowicz K, Choroszy M, Waszczuk E (2020) Changes in the composition of the human intestinal microbiome in alcohol use disorder: a systematic review. Am J Drug Alcohol Abuse 46(1): 4-12.
- Vassallo G, Mirijello A, Ferrulli A, Antonelli M, Landolfi R, et al. (2015) Review article: Alcohol and gut microbiota-the possible role of gut microbiota modulation in the treatment of alcoholic liver disease. Aliment Pharm Ther 41(10): 917-927.
- Llopis M, Cassard AM, Wrzosek L, Boschat L, Bruneau A, et al. (2016) Intestinal microbiota contributes to individual susceptibility to alcoholic liver disease. Gut 65(5): 830-839.
- Hartmann P, Seebauer CT, Schnabl B (2015) Alcoholic liver disease: The gut microbiome and liver cross talk. Alcohol Clin Exp Res 39(5): 763- 775.
- Ni YQ, Lohinai Z, Heshiki Y, Dome B, Moldvay J, et al. (2021) Distinct composition and metabolic functions of human gut microbiota are associated with cachexia in lung cancer patients. ISME J15(11): 3207- 3220.
- Spahr L, Goossens N, Furrer F, Dupuis M, Vijgen S, et al. (2018) A return to harmful alcohol consumption impacts on portal hemodynamic changes following alcoholic hepatitis. Eur J Gastroen Hepat 30(8): 967-974.
- Louvet A, Naveau S, Abdelnour M, Ramond MJ, Diaz E, et al. (2007) The lille model: A new tool for therapeutic strategy in patients with severe alcoholic hepatitis treated with steroids. Hepatology 45(6): 1348-1354.
- Liver EAS (2018) EASL Clinical Practice Guidelines for the management of patients with decompensated cirrhosis. J Hepatol 69(2): 406-460.
- Moyer VA (2013) Screening and behavioral counseling interventions in primary care to reduce alcohol misuse: US preventive services task force recommendation statement. Ann Intern Med 159(3): 210-218.
- Kyle UG, Bosaeus I, De Lorenzo AD, Deurenberg P, Elia M, et al. (2004) Bioelectrical impedance analysis--part I: review of principles and methods. Clin Nutr 23(5): 1226-1243.
- Kyle UG, Genton L, Karsegard L, Slosman DO, Pichard C (2001) Single prediction equation for bioelectrical impedance analysis in adults aged 20-94 years. Nutrition 17(3): 248-253.
- Gonzalez MC, Barbosa-Silva TG, Bielemann RM, Gallagher D, Heymsfield SB (2016) Phase angle and its determinants in healthy subjects: influence of body composition. Am J Clin Nutr 103(3): 712-716.
- Selberg O, Selberg D (2002) Norms and correlates of bioimpedance phase angle in healthy human subjects, hospitalized patients, and patients with liver cirrhosis. Eur J Appl Physiol 86(6): 509-516.
- Bolger AM, Lohse M, Usadel B (2014) Trimmomatic: a flexible trimmer for Illumina sequence data. Bioinformatics 30(15): 2114-2120.
- Ounit R, Wanamaker S, Close TJ, Lonardi S (2015) CLARK: fast and accurate classification of metagenomic and genomic sequences using discriminative k-mers. BMC Genomics 16: 236.
- Beghini F, McIver LJ, Blanco-Miguez A, Dubois L, Asnicar F, et al. (2021) Integrating taxonomic, functionan and strain-level profiling of diverse microbial communities with bio-Bakery 3. Elife 4: e65088.
- Wood DE, Lu J, Langmead B (2019) Improved metagenomic analysis with Kraken 2. Genome Biol 20(1): 257.
- Clarke EL, Taylor LJ, Zhao C, Connell A, Lee JJ, et al. (2019) Sunbeam: an extensible pipeline for analyzing metagenomic sequencing experiments. Microbiome 7(1): 46.
- Lu J, Breitwieser FP, Thielen P, Salzberg SL (2017) Bracken: estimating species abundance in metagenomics data. Peer J Computer Science.
- Love MI, Huber W, Anders S (2014) Moderated estimation of fold change and dispersion for RNA-seq data with DESeq2. Genome Biol 15(12): 550.
- Cederholm T, Jensen GL, Correia M, Gonzalez MC, Fukushima R, et al. (2019) GLIM criteria for the diagnosis of malnutrition - A consensus report from the global clinical nutrition community. Clin Nutr 38(1): 1-9.
- Escapa IF, Chen T, Huang Y, Gajare P, Dewhirst FE (2018) New insights into human nostril microbiome from the expanded human oral microbiome database (eHOMD): A resource for the microbiome of the human aerodigestive tract. mSystems 3(6): e00187- e00218.
- Fenn K, Strandwitz P, Stewart EJ, Dimise E, Rubin S (2017) Quinones are growth factors for the human gut microbiota. Microbiome 5(1): 161.
- Liver EAS (2019) EASL clinical practice guidelines on nutrition in chronic liver disease. J Hepatol 70(1): 172-193.
- Windham CT, Wyse BW, Hansen RG (1983) Alcohol consumption and nutrient density of diets in the nationwide food consumption survey. J Am Diet Assoc 82(4): 364-370.
- Foltin RW, Kelly TH, Fischman MW (1993) Ethanol as an energy source in humans: comparison with dextrose-containing beverages. Appetite 20(2): 95-110.
- Cheung K, Lee SS, Raman M (2012) Prevalence and mechanisms of malnutrition in patients with advanced liver disease, and nutrition management strategies. Clin Gastroenterol Hepatol 10(2): 117-125.
- Peng S, Plank LD, McCall JL, Gillanders LK, McIlroy K (2007) Body composition, muscle function, and energy expenditure in patients with liver cirrhosis: a comprehensive study. Am J Clin Nutr 85(5): 1257-1266.
- Coulson CE, Williams LJ, Brennan SL, Berk M, Kotowicz MA, et al. (2013) Alcohol consumption and body composition in a population-based sample of elderly Australian men. Aging Clin Exp Res 25(2): 183-192.
- Martin-Gonzalez C, Gonzalez-Reimers E, Santolaria-Fernandez F, Fernandez-Rodriguez C, Garcia- Valdecasas-Campelo E, et al. (2011) Prognostic value of changes in lean and fat mass in alcoholics. Clin Nutr 30(6): 822-830.
- Dubinkina VB, Tyakht AV, Odintsova VY, Yarygin KS, Kovarsky BA, et al (2017) Links of gut microbiota composition with alcohol dependence syndrome and alcoholic liver disease. Microbiome 5(1): 141.
- Qin N, Yang F, Li A, Prifti E, Chen Y, et al (2014) Alterations of the human gut microbiome in liver cirrhosis. Nature 513(7516): 59-64.
- Kim SS, Eun JW, Cho HJ, Song DS, Kim CW, et al (2021) Microbiome as a potential diagnostic and predictive biomarker in severe alcoholic hepatitis. Aliment Pharmacol Ther 53(4): 540-551.
- Lang S, Fairfied B, Gao B, Duan Y, Zhang X, et al. (2020) Changes in the fecal bacterial microbiota associated with disease severity in alcoholic hepatitis patients. Gut Microbes 12(1): 1785251.
- Chen Y, Yang F, Lu H, Wang B, Chen Y, et al. (2011) Characterization of fecal microbial communities in patients with liver cirrhosis. Hepatology 54(2): 562-572.
- Puri P, Liangpunsakul S, Christensen JE, Shah VH, Kamath PS, et al. (2018) The circulating microbiome signature and inferred functional metagenomics in alcoholic hepatitis. Hepatology 67(4): 1284-1302.
- Shen TD, Daniel SG, Patel S, Kaplan E, Phung L, et al. (2021) The mucosally-adherent rectal microbiota contains features unique to alcohol-related cirrhosis. Gut Microbes 2021, 13(1):1987781.
- Bajaj JS, Kakiyama G, Zhao D, Takei H, Fagan A, et al. (2017) Continued alcohol misuse in human cirrhosis is associated with an impaired gutliver axis. Alcohol Clin Exp Res 41(11): 1857-1865.
- Bajaj JS, Heuman DM, Hylemon PB, Sanyal AJ, White MB, et al (2014) Altered profile of human gut microbiome is associated with cirrhosis and its complications. J Hepatol 60(5): 940-947.
- Smirnova E, Puri P, Muthiah MD, Daitya K, Brown R, et al. (2020) Fecal microbiome distinguishes alcohol consumption from alcoholic hepatitis but does not discriminate disease severity. Hepatology 72(1): 271- 286.
- Grander C, Adolph TE, Wieser V, Lowe P, Wrzosek L, Gyongyosi B, et al (2018) Recovery of ethanol induced Akkermansia muciniphila depletion ameliorates alcoholic liver disease. Gut 67(5): 891-901.
- Vujkovic-Cvijin I, Sklar J, Jiang L, Natarajan L, Knight R (2020) Host variables confound gut microbiota studies of human disease. Nature 587(7834): 448-454.
- Ames NJ, Barb JJ, Schuebel K, Mudra S, Meeks BK, et al (2020) Longitudinal gut microbiome changes in alcohol use disorder are influenced by abstinence and drinking quantity. Gut Microbes 11(6): 1608-1631.
- Yang AM, Inamine T, Hochrath K, Chen P, Wang L, et al. (2017) Intestinal fungi contribute to development of alcoholic liver disease. J Clin Invest 127(7): 2829-2841.
- Chen Y, Qin N, Guo J, Qian G, Fang D, et al. (2014) Functional gene arraysbased analysis of fecal microbiomes in patients with liver cirrhosis. BMC Genomics 15: 753.
SUPPLEMENT REFERENCES
- Louis P, Flint HJ (2009) Diversity, metabolism and microbial ecology of butyrate-producing bacteria from the human large intestine. FEMS Microbiol Lett 294(1): 1-8.
- Louis P, Flint HJ (2017) Formation of propionate and butyrate by the human colonic microbiota. Environ Microbiol 19(1): 29-41.
- Louis P, Young P, Holtrop G, Flint HJ (2010) Diversity of human colonic butyrate-producing bacteria revealed by analysis of the butyryl-CoA:acetate CoA-transferase gene. Environ Microbiol 12(2): 304-314.
- Vital M, Karch A, Pieper DH (2017) Colonic butyrate-producing communities in humans: an overview using omics data. mSystems 2(6): e00130-e00217.
- Riviere A, Selak M, Lantin D, Leroy F, De Vuyst L (2016) Bifidobacteria and butyrate-producing colon bacteria: importance and strategies for their stimulation in the human gut. Front Microbiol 7: 979.
- Reichardt N, Duncan SH, Young P, Belenguer A, McWilliam Leitch C, et al. (2014) Phylogenetic distribution of three pathways for propionate production within the human gut microbiota. ISME J 8(6): 1323-35.
- Maline G (2021) Identification and characterization of butyrateproducing species in the human gut microbiome. https://digitalcommons. unomaha.edu/cgi/viewcontent.cgi?article=1136&context=universit y_ honors_program: University of Nebraska Omaha; 2021.
Article Type
Research Article
Publication history
Received Date: September 09, 2022
Published: October 13, 2022
Address for correspondence
Laurent Spahr, Gastroenterology and Hepatology, University Hospitals of Geneva and Faculty of Medicine, Geneva, Switzerland
Copyright
©2022 Open Access Journal of Biomedical Science, All rights reserved. No part of this content may be reproduced or transmitted in any form or by any means as per the standard guidelines of fair use. Open Access Journal of Biomedical Science is licensed under a Creative Commons Attribution 4.0 International License
How to cite this article
Genton L, Dizdar OS, Lazarevic V, Mauffrey F, Leo S, Herrmann F, Collet TH, Karsegard VL, Viatte V, Schrenzel J, Spahr L. Changes Over 6 Months of Gut Microbiota and Nutritional Parameters In patients with Alcoholic Liver Disease: A Prospective Study. 2022- 4(5) OAJBS.ID.000498.
Figure 1: NMDS of the microbiota bacterial communities of AH and AC samples at baseline (T0) (A), month 3 (B) and month 6 (C). Bray–Curtis dissimilarity between AH and AC microbial communities at each time point are represented in a boxplot (D) and differences were tested with a Wilcoxon signed-rank test (p values are reported in the figure). For easier visual distinction, the area formed by samples corresponding to each AH and AC are shadded. AC = Patients with alcoholic cirrhosis; AH = Patients with alcoholic hepatitis.
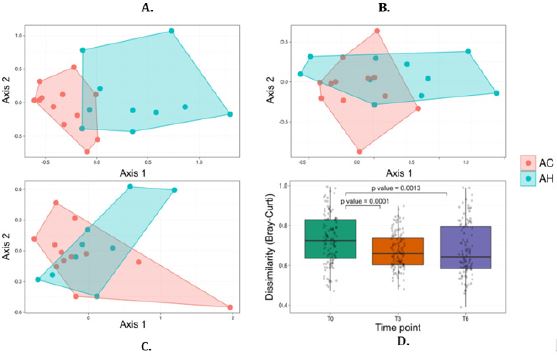
Figure 2: Cumulative abundance (%) of bacteria typically found in the human oral microbiota (A) or identified as
short-chain fatty acid (SCFA) producers (B), at each time point. Oral-like species correspond to species listed in the
HOMD and being more abundant at any oral site than in stools according to human microbiome profiles available
at (https://www.ezbiocloud.net/resources/human_microbiome). P values were reported when significant (Mann–
Whitney U test or Wilcoxon signed-rank test). AC = Patients with alcoholic cirrhosis; AH = Patients with alcoholic
hepatitis.
T0; baseline; T3 = follow-up at month 3; T6 = follow-up at month 6.
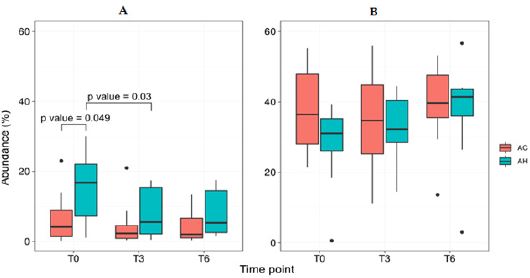
Table 1: Baseline characteristics of patients with alcoholic hepatitis and alcoholic cirrhosis.
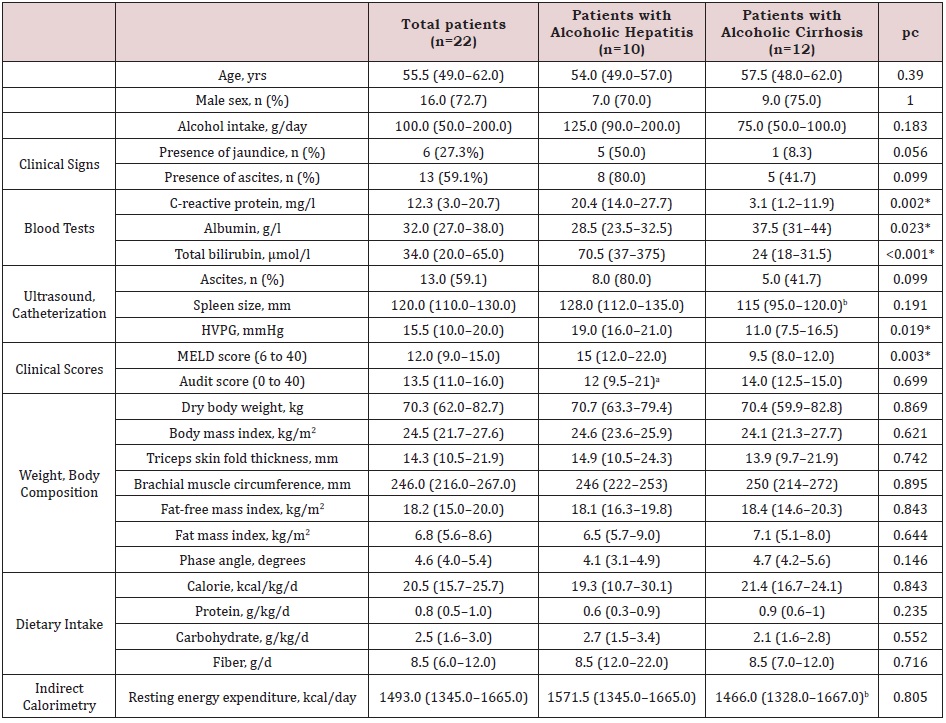
Note: Data expressed as median (interquartile range) or number (percentage); HVPG: hepatic venous pressure gradient;
MELD: Model for end-stage liver disease
an=8; bn=11; cMann–Whitney U test for continuous variables, and Fisher’s exact test for categorical variables * significant p
value after correction for multiple testing by Benjamini–Hochberg.
Table 2: Multiple mixed linear regression models adjusted for visit number, to predict changes in clinical, laboratory and nutritional parameters of patients with alcoholic liver cirrhosis (n=12) vs. hepatitis (n=10, reference group).
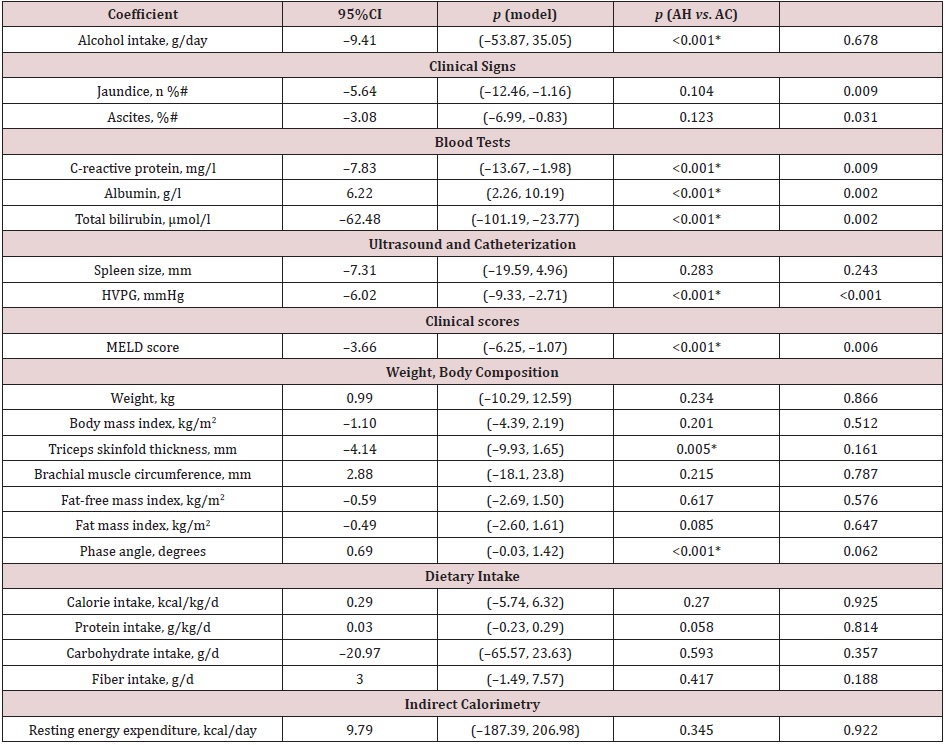
Table 3: Associations between microbiota composition and study parameters at baseline (T0), month 3 (T3) and month 6 (T6), assessed by distance-based linear model (DISTLM).
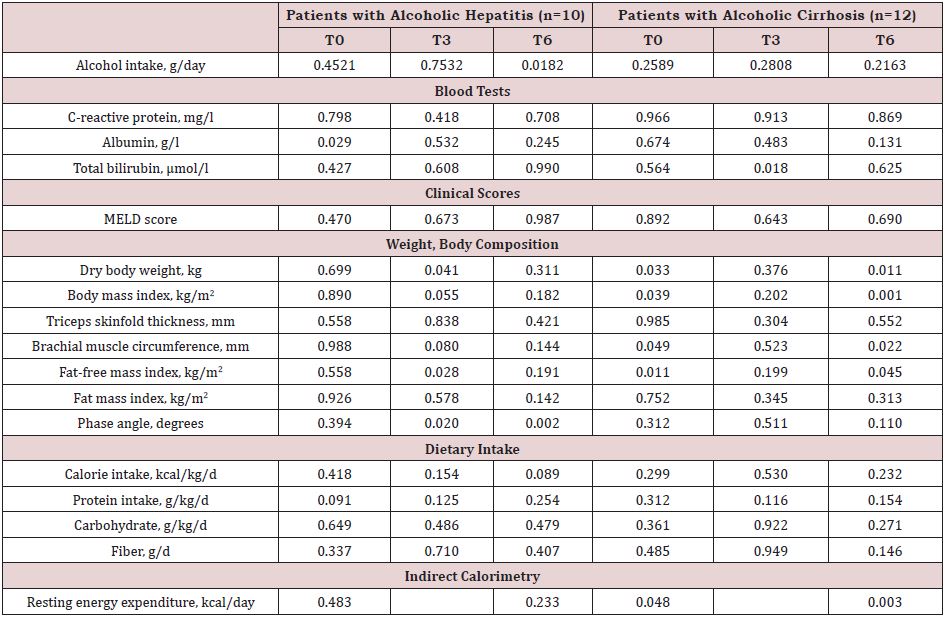
Note: No significant p value after correction for multiple testing by Benjamini–Hochberg.
Supplemental Figure 1: Flow chart of the study.
Supplemental Figure 2: Line plots showing the evolution of median values of selected parameters in AC (plain grey lines) and AH (dashed black lines) patients. These parameters were selected because the multiple mixed linear regression models predicting their change highlighted a significant interaction between group (AH vs. AC) and visit number. AC = Patients with alcoholic cirrhosis; AH = Patients with alcoholic hepatitis.
Supplemental Figure 3: Intraindividual temporal changes in the gut bacterial communities along nMDS axes of AC (A: T3–T0; B: T6–T0) and AH (C: T3– T0; D: T6–T0) patients. The baseline microbiota profile (T0) of each patient is placed at the axes origin and connected to the T3 or T6 follow-up (T3 or T6) profile (circle). Each of the four panels were generated by selecting relevant samples from a common NMDS plot based on all samples. The top five vectors of correlation (R^2 > 0.44) between the relative abundance of bacterial species and NMDS axes are presented (grey arrows). Species names are indicated in panel A only. Patients who became alcohol abstinent over the followup are shown in red and those who did not in blue (number 73 was abstinent from T0 to T3 but restarted drinking afterwards). Changes along axis 1 were significantly different between AH and AC for both T3–T0 and T6–T0 (p = 0.0006 and 0.01839, respectively). AC = Patients with alcoholic cirrhosis; AH = Patients with alcoholic hepatitis.
Supplemental Figure 4: Shannon diversity index for AC and AH samples at each time points. Significant changes (Mann–Whitney U test or Wilcoxon signed-rank test) are shown. AC = Patients with alcoholic cirrhosis; AH = Patients with alcoholic hepatitis.
Supplemental Table 1: Collected data at each visit.
Supplemental Table 2: Evolution of the study parameters of the patients with alcoholic hepatitis or cirrhosis.
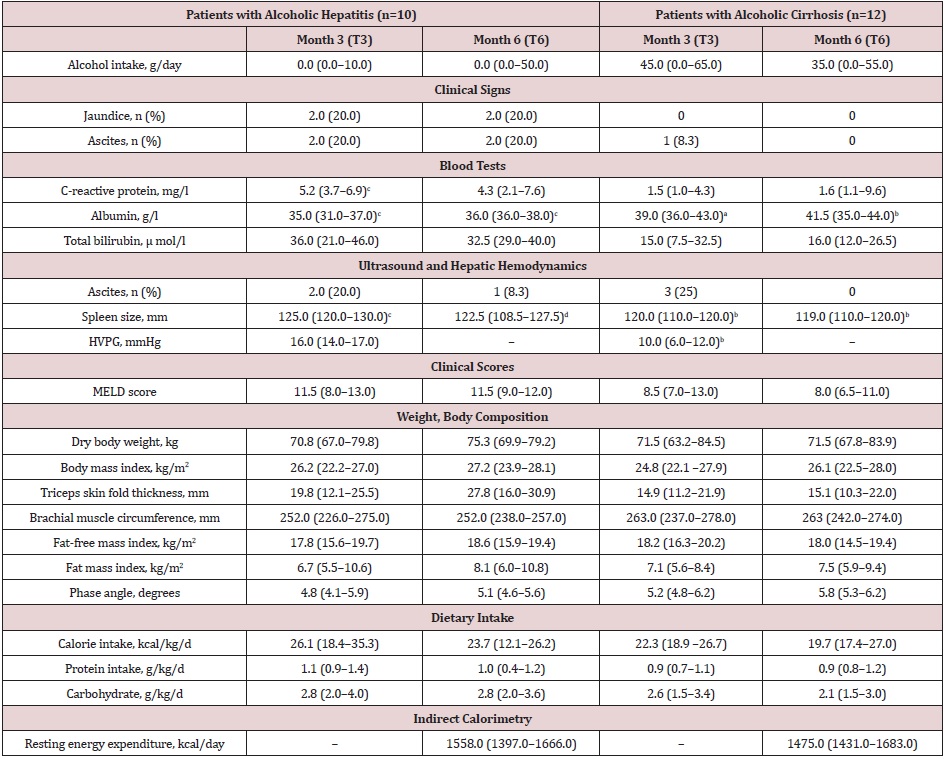
Note: Data expressed as median (interquartile range) or number (percentage); HVPG: hepatic venous pressure gradient; MELD: Model for end-stage liver disease. an=11; bn=10; cn=9; dn=8
Supplemental Table 3: Heatmap of the relative abundance of bacterial taxa above the species level (median) for AC and AH samples at baseline (T0), month 3 (T3) and month 6 (T6). Only species with a significant abundance difference in at least one comparison, assessed by DESeq2, are displayed. The species relative abundance and fold change scales are given below the plot. AC = Patients with alcoholic cirrhosis; AH = Patients with alcoholic hepatitis.
Supplemental Table 4: Heatmap of bacterial species adundance (median) for AC and AH samples at baseline (T0), month 3 (T3) and month 6 (T6). Only species with a significant abundance difference in at least one comparison, assessed by DESeq2, are displayed. The species relative abundance and fold change scales are given below the plot. HOMD, human oral microbiome database O, oral species listed in the HOMD, more abundant in at least one oral site than in stool (according to https://www.ezbiocloud.net/resources/human_microbiome); (O), oral species listed in the HOMD, more abundant in stool than at all oral sites; B, butyrate producer; P, propionate producer. Known and putative butyrate- and propionate-producing species were compiled from the following sources: 1–7. AC = Patients with alcoholic cirrhosis; AH = Patients with alcoholic hepatitis.
Supplemental Table 5: Heatmap of viral families for AC and AH patients at baseline (T0), month 3 (T3) and month 6 (T6). The abundance scale is below the plot. Black cells indicate undetected families. Samples from different patients are separated by white spaces. The statistical tests used were Mann–Whitney U (AC vs. AH) and Wilcoxon signed-rank (T3 vs. T0 and T6 vs. T0). AC = Patients with alcoholic cirrhosis; AH = Patients with alcoholic hepatitis.
Supplemental Table 6: Heatmap of fungal genera for AC and AH patients at baseline (T0), month 3 (T3) and month 6 (T6). Only genera with > 0.2 reads per million bacterial reads are shown. The abundance scale is below the plot. Black cells indicate undetected genera. Samples from different patients are separated by white spaces. The statistical tests used were Mann– Whitney U (AC vs. AH) and Wilcoxon signed-rank (T3 vs. T0 and T6 vs. T0). AC = Patients with alcoholic cirrhosis; AH = Patients with alcoholic hepatitis.
Supplemental Table 7: Heatmap of metabolic pathways adundance (median) for alcoholic cirrhosis (AC) and alcoholic hepatitis (AH) samples at baseline, month 3 and month 6.