Body Composition and Different Criteria for Obesity Evaluation in Type 2 Diabetic Patients with and Without Angiopathy
ABSTRACT
Background: A single method is not suitable for obesity and body fat evaluation in type 2 diabetic patients. An observational analytical case control study was performed in Caucasian type 2 diabetic and non-diabetic subjects to compare body fatness, obesity prevalence and to evaluate type 2 diabetes (DT2) and angiopathy contribution to obesity prevalence.
Methodology: A total of 293 adults were studied in three groups: GI - 75 type 2 diabetic subjects with angiopathy; GII - 75 type 2 diabetic subjects without angiopathy; GIII - 143 controls. Body composition was assessed by bioelectrical impedance analysis and body fatness estimated by nine anthropometric equations. Obesity prevalence was calculated using three criteria: BMI, waist circumference and body fat percentage.
Results: According to BMI, the obesity prevalence was (GI: 57.3%; GII: 45.4%; GIII: 16.8%). The abdominal obesity prevalence was similar in diabetics (70.7%) and significantly higher than in non-diabetic subjects (51.0%). The obesity prevalence calculated by bioelectrical impedance analysis was higher than 70% in all groups. According to BF%, the DT2 and angiopathy presence did not increase the probability to have obesity. Deurenberg equation from 1998 was the most accurate and showed the lowest variability when compared to bioelectrical impedance. It was found that the prevalence of dehydration in the studied population was very high (>55%).
Conclusion: Body composition assessment is an important tool to evaluate the nutritional status of diabetic patients. The anthropometric equations based on direct measurements of skinfold thickness underestimate BF% and demonstrate a weak agreement with BIA method. Some of the equations based on BMI, age and gender agreed with all validation criteria and are suitable to predict body fatness in epidemiological studies or clinical settings. For body fat assessment, in Caucasian diabetic patients, the application of the Deurenberg equation seems to be the best choice when other more accurate methods cannot be used.
KEYWORDS
Diabetes; Angiopathy; Obesity; Body fat; Skinfold thickness; Bioimpedance
INTRODUCTION
Diabetes mellitus, obesity and cardiovascular diseases are the major public health problems in the world [1,2]. According to a diabetes prevalence study in Portugal, one millions of people have diabetes mellitus and around one million and eight hundred thousand of Portuguese have prediabetes [3]. Anthropometry is an important tool for nutritional status assessment. BMI is a common marker for fatness [4] and is useful to identify overweight and obesity in clinical practice [5,6]. BMI does not directly assess how much fat a person has but it is an indirect assessment based on the principle that a higher body mass is due to an increasing percentage of the body fat mass. There are several methods to assess wholebody fat [6]. Skinfolds measurement is the most popular method because of the low cost and practicality, but many researchers and clinicians have questioned the results of body composition assessments performed using skinfold fat measurements [7].
Bioelectrical impedance analysis (BIA) was developed to study the body composition, with the advantage of being precise, reproducible, safe, non-invasive, portable and rapid [8]. This method has been used in a wide range of groups including the obese, diabetic, heart failure and cancer patients [9]. BIA could represent the ideal method for clinical and epidemiological studies in replacement of common reference methods (eg. dual-energy x-ray absorptiometry - DEXA) that cannot be used routinely in clinical practice because of its limited availability, cost and lack of mobility [10]. Data on the validity of body composition measured by BIA method in diabetic patients was previously reported [11,12]. These studies reported that body fat percentage assessed by BIA method was not significantly different from DEXA in type 2 diabetic patients. Despite of that, the lack of validity of the BIA method to evaluate changes on body composition after weight loss has been previously described, although it can be an excellent tool to assess body composition in cross-sectional studies or routine assessment of body composition among people with type 2 diabetes mellitus [12,13].
It is now accepted that a single method is not sufficient to provide accurate and precise information for obesity and body fat evaluation [14]. Indeed, the comparison of simple methods such as BMI, skinfolds measurements and BIA can be an excellent tool to evaluate nutritional status. As far as we know, no data is available regarding the comparison of different methods to assess body fatness and obesity in Portuguese type 2 diabetic subjects with and without angiopathy. In the present work, a comparison of different criteria to evaluate the obesity prevalence and to assess body composition differences in Portuguese type 2 diabetic patients (with and without angiopathy) and non-diabetic subjects was performed.
METHODS
Study population
An observational cross-sectional study was performed in 150 type 2 diabetic patients from the Portuguese Diabetes Association and 143 healthy adults from the International University for Seniors. All the participants were recruited by phone and personal invitation. The study population was categorized in three groups: group I (n = 75) was formed by type 2 diabetic patients with angiopathy, group II (n = 75) by type 2 diabetic patients without angiopathy and group III (n = 143) by non-diabetic subjects. Previous sample size calculations were performed with Power and Sample Size Calculation software program, version 2.1, and the estimation showed that a minimum of 31 subjects were satisfactory in groups I and II, for an alpha value of 5% and a power of 90%. The sample size calculation has also taken into account the adjustment for the potential confounders.
The following inclusion criteria were applied for all groups: a) written informed consent; b) age 40-75 years; and c) caucasian origin. Additional, inclusion criterion for groups I and II was type 2 diabetes diagnosis for at least 1 year. Furthermore, for group I the presence of at least one of the following angiopathic complications: macroangiopathy (coronary heart disease, stroke, peripheral vascular disease) and/or microangiopathy (retinopathy), was also required. The presence of angiopathic complications was confirmed by the access to the patient medical records. Exclusion criteria for BIA measurements in all groups were the presence of pacemakers or body metal screws.
Ethical statement
This study was conducted according to the guidelines laid down in the Declaration of Helsinki [15] and all procedures involving human subjects/patients were approved by the Ethics Committees of National Institute of Health Dr. Ricardo Jorge, Faculty of Medicine from University of Lisbon and Portuguese Diabetes Association. Written and informed consent was obtained from all subjects/ patients.
General, clinical and physiological data
A general questionnaire was developed according to the 4th National Health Survey 2005-2006 [16] and applied to all participants. Information on smoking habits, medical history of personal and family history of cardiovascular disease was obtained. The access to medical records of diabetic participants provided information on duration of diabetes, presence of angiopathy and insulin dependence. A short form of the International Physical Activity Questionnaire was applied by interview [17]. Blood pressure and heart rate were measured two times on the left arm after at least 10 min rest in the seated position using an R6 (HEM-6052-E) wrist blood pressure monitor from Omron® (OMRON Management Center of America, Inc., Schaumburg, USA). Hypertension was defined for all groups by the presence of a systolic blood pressure ≥140 mmHg and/or a diastolic blood pressure ≥80mmHg [18]. Dyslipidemia was considered to be present when one of the following situations occurred: triglycerides (TG) ≥150 mg/dl, high-density lipoprotein cholesterol (HDL-C) less than ≤40 in men and ≤50 mg/dl in women, low-density lipoprotein cholesterol (LDL-C) at ≥100 mg/dl and previously diagnosed dyslipidemia [18]. Metabolic control of diabetes was classified unsatisfactory when glycosylated haemoglobin (HbA1c) level was greater than 7% [18].
Anthropometric measurements
A nutritionist was trained to collect all anthropometric measurements in a standardized way following international procedures [19]. The following anthropometric variables were collected: weight, height, waist circumference, triceps, subscapular, suprailiac and abdominal skin folders. Body weight was measured in kilograms to the nearest 100 g using a BF552 TANITA® scale (Tanita Corporation of America, Inc., Illinois, USA). Height was measured using an ADE® ultrasonic stadiometer (ADE GmbH & Co., Hamburg, Germany). The BMI was defined as weight/height2 (kg/m2). Abdominal obesity, pre-obesity and obesity were defined according to WHO criteria [20,21]. The skin folders thickness was measured on the left side of the body to the nearest 0.1 mm with a Harpenden skinfold caliper (John Bull British Indicators Ltd., Herts, England) [19].
Body fat assessment by skinfold thickness
Three groups of equations were used to calculate body fat percentage (BF%). The first group predicts BF% directly from skinfold thicknesses, as the equations published by Lohman [22], Boileau [23] and Faulkner [24]. The second type of equations predict BF% by calculating first the body density using the log sum of four skinfold thicknesses [25] and then, another equation to calculate the BF% for a given density [26]. The third group of equations estimates BF% directly from BMI, age and gender [27- 31].
Bioelectrical impedance analysis
Whole-body bioelectrical impedance was measured by using a tetrapolar and single-frequency (50 kHz) analyzer from Maltron (BF-907, Maltron International Ltd, UK). All measurements were made by the same person according to manufacture instructions and the European Society for Clinical Nutrition and Metabolism guidelines [9]. Data on BF, free fat mass (FFM) and total body water (TBW) were also obtained by BIA application.
Statistical analysis
All statistical analysis was performed in SPSS for Windows, version 20.0 (SPSS Inc, Chicago). Results are expressed as mean ± standard deviation (SD) or as percentage. The variables normality was evaluated by the Kolmogorov-Smirnov test. Categorical variables were compared with the Chi-square test or z-test for proportions. Comparison between groups of numeric variables normally distributed means was performed by one-way analysis of variance. Post hoc tests Bonferroni multiple comparisons were used to determine which means are significantly different from the others. Bivariate associations between numeric variables were assessed using Pearson correlation coefficients. The odd ratio and (95% confidence interval) were used to studied associations of body fat with type 2 diabetes and angiopathy. Statistical significance was considered for P<0.05>.
RESULTS
Characteristics of the study population
The baseline clinical and laboratory characteristics according to the study population are summarized in Table 1. In groups I and II, the mean value of HbA1c was higher than the recommended value (7%) for an adequate metabolic control of type 2 diabetes mellitus [18]. Plasma levels of HDL-C were higher in group III compared to both groups of diabetic subjects. The mean triglycerides levels were significantly lower in group III (1.19 ± 0.52 mM) compared to the other two groups (I: 2.19 ± 1.07 mM vs. II: 1.94 ± 1.21 mM). The duration of diabetes was also significantly higher in group I (19.4 ± 9.33 years) in relation to group II (13.5 ± 7.95 years). The average systolic blood pressure was statistically different in the three groups (I: 154 ± 20.3 mmHg vs. II:. 146 ± 25.9 mmHg vs. III: 136 ± 19.8 mmHg).
Angiopathy and cardiovascular risk factors
Table 2 shows the prevalence of several angiopathic complications of diabetes and conventional cardiovascular risk factors. For group I, macroangiopathy was present in 44.1% of the patients; microangiopathy in 82.6% and 34% of them had macroand microangiopathy. The prevalence of stroke, coronary heart disease and peripheral vascular disease among group I was 10.7%, 10.7% and 22.7%, respectively. Retinopathy was the most prevalent angiopathic complication. Subjects in group I were more frequently insulin-dependent and had a poorer metabolic control of diabetes (HbA1c >7%) than subjects from group II. Family antecedents of cardiovascular disease were high in all groups, but especially in group I (61.3%). The subjects of group III were more active than diabetic subjects, although the percentage of sedentarism in this group was high (64.3%). The three levels of physical activity were related to the percentage of body fat. In group I, the prevalence of sedentary subjects with a high percentage of body fat was 65.7%, in group II was 60.3% and in group III 20.1%. These results indicate that a sedentary lifestyle is associated with the prevalence of high body fat.
The frequency of hypertension in group I was 77.0%, almost two times higher than in group III (39.2%). The prevalence of dyslipidemia was very high in all groups (group I: 94.2% vs. group II: 93.2% vs. group III: 95.6%), especially due to the frequent high levels of plasmatic LDL-C. It was also demonstrated by applying the Z test for comparison of proportions that the prevalence of hypertension was significantly higher in groups I and II compared to group III and that the prevalence of hypertriglyceridemia was significantly higher in group I when compared with the other two groups. No statistical differences were observed in the prevalence of dyslipidemia in the three groups (P=0.725). The prevalence of low concentrations of HDL-C and high LDL-C concentrations is statistically different in both diabetic groups in comparison to group III.
Nutritional assessment
The results of anthropometric and body composition measurements are shown in Table 3. There were significant differences in the mean values of weight, waist circumference, BMI and subscapular skinfold thickness between group III and groups I and II (P<0.001), but no statistical differences were observed between diabetic patients with and without angiopathy. The mean value for BMI, was lower in men than women for groups I and III. When the mean values of BF% were obtained by application of Boileau, Deurenberg (1998), Gallagher, Jackson & Pollock and Heritage equations, statistical differences were achieved when groups were compared. The comparison of BF% mean values achieved by the anthropometric equations and by BIA was performed. For group I, the mean value for BF% calculated by application of the Jackson & Pollock equation (38.3 ± 11.1) was the nearest to BIA mean value, followed by the Gallagher equation (38.4 ± 10.2). For group II, the BF% mean value obtained using the Gallagher equation (37.6 ± 7.7) was the most similar to BIA, and the Jackson & Pollock equation (37.3 ± 8.3) was the second closest. For group III, the equations of Deurenberg (1991) (38.4 ± 6.9%) and from 1998 (36.0 ± 7.3%) gave more similar mean values to the BIA result. The three equations that predict BF% directly from skinfolds gave very low mean values (mean value was at least -8.5%) compared to BIA values. The SD of BF% measured using BIA ranged from 7.4% in group II to 8.4% in group I. This variation was similar to Deurenberg (1991) (from 6.8% to 8.9%), Deurenberg (1998) (from 7.2% to 9.4%) and Heritage study (from 7.1% to 9.5%) equations. The body compositions assessed by BIA also allowed obtain results for FFM and TBW. With respect to the FFM, significant differences between group III (41.9 kg) and other groups (I: 48.7 kg vs. II: 47.4 kg) were observed. In relation to TBW measurement volume significant differences between group III (30.6 litres) and the other groups (I: 35.6 litres vs. II: 34.7 litres) were also observed. The prevalence of dehydration in each group was also evaluated comparing the TBW value of each participant with a reference range presented in the BIA equipment. The prevalence of dehydration was very high for all groups (I: 67.1% vs. II: 61.6% vs. III: 58.4%). For diabetic subjects, it should be taken into account that osmolarity changing is characteristic of this chronic disease. Despite of that for non-diabetic subjects a high prevalence of an inadequate hydration was also found. In addition, the daily water intake was also assessed by applying a semi-quantitative food frequency questionnaire. The mean results showed that the average daily water intake was significant higher in diabetic subjects (group I: 1244 ± 443 litres vs. group II: 1235 ± 280 litres) than in non-diabetic (1024 ± 228 litres), but for all groups it was lower than the recommended value by the European Food Safety Authority [32, 33].
Obesity evaluation
Obesity evaluation using BMI, waist circumference and BF% criteria in study population is described in Table 4. The prevalence of preobesity in group I (26.7%) was significantly lower than in groups II (42.6%) and III (40.5%). The prevalence of obesity was higher in diabetic subjects with angiopathy (57.3%) than those without angiopathy (45.4%) and more than three times higher than in non- diabetic subjects (16.8%). The frequency of abdominal obesity was high in all groups (more than>50%) but significantly higher in diabetic patients than in non-diabetic subjects. The BF% was evaluated by the results obtained with four anthropometric equations and by BIA. The equations used in this evaluation were chosen according to the following criteria: type of anthropometric equation and those with the closest mean value compared to the BIA result. The application of the Boileau equation showed the lowest prevalence of high BF% for all groups when compared to the results obtained by BIA. The equations of Deurenberg (1998) and Gallagher gave similar results to those obtained by BIA method. According to BIA method the prevalence of subjects with BF% above the recommended value [34] was very high for all the study groups (group I: 87.1% vs. group II: 83.6% vs. group III: 76.1%). The effect of the type 2 diabetes presence in the prevalence of obesity was evaluated. According to the BMI criterion, the diabetic patients had a higher probability to have obesity (OR: 4.11; CI95%: 2.18-7.73; P<0.001). When the criterion was the waist circumference evaluation, the probability of diabetic patients to have obesity was 2.31 times higher when compared with nondiabetic subjects (CI95%: 1.27-4.19; P=0.006). According to BF% criterion, the OR showed a trend for association but the obtained was not statistically significant (OR: 2.13; CI95%: 0.96-4.75; P<0.065). The effect of the angiopathy presence in the prevalence of obesity was also evaluated, although the obtained OR for all the criteria was not statistically different. The combined effect of the type 2 diabetes and angiopathy presence in the obesity prevalence were evaluated. According to the BMI, the probability of diabetic patients with angiopathy to have obesity was 6.66 higher when compared with non-diabetic subjects (CI95%: 3.56-12.6; P<0.001). For abdominal obesity, the combined effect of type 2 diabetes and angiopathy presence did not increase the probability to have obesity (OR = 2.31; CI95%: 1.27-4.19; P=0.006). The OR obtained with the BF% criterion was 1.6 but it was not significant (CI95%: 0.77-3.32; P=0.21).
Comparison between BIA and BF anthropometric equations
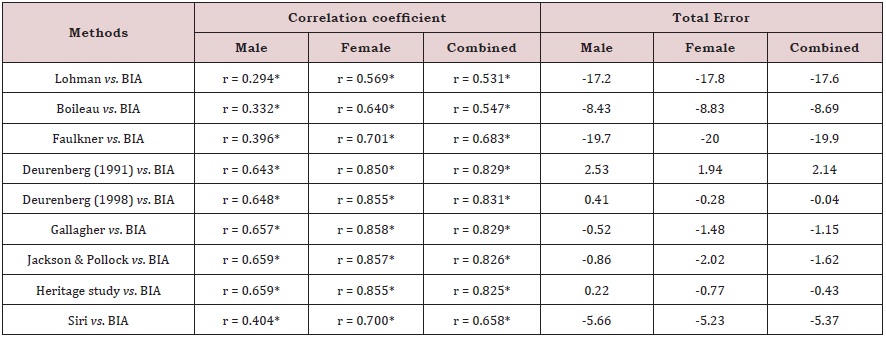
The BF% estimated by anthropometric equations were evaluated and compared with the BIA method by the Bland- Altman analysis (Figure 1). All the anthropometric equations (except for Jackson & Pollock) showed a good agreement with BIA method, because the limits of agreement included at least 95% of differences between the two measurement methods. The best three agreements were obtained for Siri equation (97.6%), Boileau equation (97.4%) and Lohman equation (96.6%). According to Lohman [35] to confirm the validity of anthropometric equations, the similarity of mean and SD values were compared, calculating Pearson correlation coefficient to check bivariate associations. The total error (TE) was also calculated because it reflects the total difference between the two measuring methods. The correlation coefficients and TE between the BF% measured with BIA method and those estimated with the anthropometric equations are presented in Table 5. Significant correlations ranged from 0.531 for Lohman equation vs. BIA to 0.831 for Deurenberg (1998) equation vs. BIA. In the overall evaluation, the TE values ranged from -19.9% for Faulkner equation to 2.14% for Deurenberg (1991) equation.
DISCUSSION
Body fat percentage is strongly related with the risk of chronic diseases such as, hypertension, dyslipidemia, diabetes mellitus, and coronary heart disease. In epidemiological studies, surrogate measures of body fatness such as BMI, waist circumference and skinfold thickness have been used extensively. However, these techniques do not accurately characterize persons by body composition (%BF or FFM), and there is substantial variation across age, gender and ethnic groups [36]. Several techniques have been used to assess BF% in controlled laboratory conditions. These include densitometry, DEXA and magnetic resonance imaging [6]. Nevertheless, these techniques are expensive and not feasible to conduct in the field because they require large specialized equipment. For these reasons, their use in epidemiological studies is limited. BIA method shows to be relatively simple (portable equipment), quick (takes only a few minutes), non-invasive and gives reliable and immediately available results of body composition with an excellent reproducibility (less than 1% error) in repeated measurements [37]. All these characteristics make this technique an appealing alternative to assess body composition in epidemiological studies.
As far as we know, limited data are available regarding the comparison between different methods for the assessment of body fatness in diabetic vs. non-diabetic subjects. Therefore, a study in healthy adults and in diabetic patients with and without angiopathy has been performed to assess differences in body fat applying several methods. Comparison of three types of equations with BIA method was performed and their suitability and validity in epidemiological studies was tested. The variability of the bioimpedance equipment was in accordance with the literature [38]. According to BF% means, SD values and correlation coefficient comparison between BIA and other methods, Deurenberg (1998) and Gallagher equations were the most accurate equations and showed the lowest variability. The BIA application is based on the principle that hydration of FFM is constant in all patients, but this is not always true. Some authors described [12,13] significant differences between BIA and reference methods in diabetic subjects during weight loss programs or training sessions, although BIA guidelines for clinical practice, don’t report special recommendations for type 2 diabetic subjects. In the present study the percentage of FFM was very similar among the three groups (group I: 62.4% vs. group II: 62.3 % vs. group III: 62.4 %) and in diabetic subjects similar to those observed (64.8%) by Ritz et al. [13]. The application of BIA method also showed that there was a very high prevalence of dehydration in all groups (>55 %).
According to the results of Bland-Altman analysis, the equations of Deurenberg [27, 28]; Gallagher and Heritage study were considered the most appropriate for use in future epidemiological studies in patients with type 2 diabetis or non-diabetic patients when the use of gold standard methods or BIA are not possible. Despite of that, the results of this analysis should be evaluated carefully, because in some cases although 95% of the results were between the limits of agreement, the TE of the anthropometric method was very high. According to Lohman criteria, the following equations: Deurenberg (1991), Deurenberg (1998), Gallagher, Jackson & Pollock and Heritage showed high correlations (r ≥0.8) with BIA method and were considered accurate because the TE were below 2% and lower than the standard error of estimate. To confirm the validity of anthropometric equations, the Lohman criteria are more suitable to compare these equations with BIA method than those established by Bland-Altman analysis. According to the Bland- Altman analysis and Lohman criteria, the anthropometric equation of Deurenberg (1998) proved to be the most suitable to evaluate the BF% in Caucasian adults with or without type 2 diabetes, because this equation showed an agreement with all the criteria and allowed to obtain a TE mean of 0.04 when compared with BIA.
Prevalence of obesity was evaluated by three methodologies: BMI, waist circumference and BF%. According to the BMI, the prevalence of obesity in diabetic patients was more than two times higher when compared with non-diabetic subjects. This result agrees with other studies reported in the literature [39- 41]. Despite of that, non-diabetic participants had a prevalence of preobesity of 41%. Abdominal obesity was high in all groups, but 20% higher in groups I and II in relation to group III. Prevalence of obesity evaluated by BF% was compared between BIA method and anthropometric equations of each type that showed a greater agreement with BIA results. For all groups and both genders, the obesity prevalence calculated by BIA method was higher than 70%. For groups I and III, the results from Deurenberg (1998) equation (88.0% vs. 71.3%) was the closest to BIA results (87.1% vs. 76.1%). It is also important to refer that, although the obesity prevalence obtained by the BMI evaluation in healthy subjects was around 17%, the frequency of obesity assessed by the BF% was huge (76.1%). In relation to diabetic patients’ significant differences were also observed between the obesity prevalence achieved by BMI or BF% evaluations. The possible explanation for this fact is that there is a weak relationship between BMI and BF%(14), because a significant percentage of subjects (8.1% vs. 2.7% vs. 20%) that were normal weight or pre-obese (30% vs. 41% vs. 59%) had excess of body fat [34]. Our results for BF% were in agreement with the results for diabetic patients or Caucasian adults published by other authors [13,14,41,42], but according to our knowledge, this is the first study that compares and evaluates BF% by several methods in Caucasian diabetic patients with and without angiopathy vs. non-diabetic subjects.
CONCLUSION
The changes in the nutritional status contribute to increase the morbidity and mortality in diabetic patients. Diabetic subjects with poor nutritional status can have a higher risk of cardiovascular complications. Body composition assessment is an important tool to evaluate the nutritional status of diabetic patients. Our study has found that BF% obtained by BIA method was similar in diabetic and non-diabetic subjects, showing that the presence of diabetes and angiopathy is not related with body fatness. Despite of that, the prevalence of high BF% was higher than 70% in all groups but the BMI and the prevalence of abdominal obesity were significantly lower in non-diabetic subjects compared to diabetic patients. This indicates that a high percentage of non-diabetic subjects are non-obese but have high BF%. In the present work, BF% estimated by nine anthropometric equations and by BIA method was also compared. The anthropometric equations based on direct measurements of skinfold thickness underestimate BF% and demonstrate a weak agreement with BIA method. Our results show that only some of the equations based on BMI, age and gender agreed with all validation criteria and are suitable to predict body fatness in epidemiological studies or clinical settings. For body fat assessment, in Caucasian diabetic patients, the application of the Deurenberg (1998) equation seems to be the best choice when other more accurate methods cannot be used, since it matches all the validation criteria and estimates BF% with a mean total error of 0.04. The presence of mild dehydration plays an important role in the development of various diseases, namely diabetes, which by changing the osmolarity promotes hyperglycaemia. It was found that the prevalence of dehydration in the studied population was very high (>55%). According to our results, it is important to educate diabetic and non-diabetic participants to maintain an adequate daily fluid intake to ensure a proper hydration.
REFERENCES
- Rivellese AA, Riccardi G, Vaccaro O (2010) Cardiovascular risk in women with diabetes. Nutr Metab Cardiovasc Dis 20(6): 474-480.
- Grantham NM, Magliano DJ, Hodge A, Jowett J, Meikle P, et al. (2012) The association between dairy food intake and the incidence of diabetes in Australia: the Australian Diabetes Obesity and Lifestyle Study (AusDiab). Public Health Nutr 16(2): 339-345.
- Gardete-Correia LG, Boavida JM, Raposo JF, Mesquita AC, Fona C, et al. (2010) First diabetes prevalence study in Portugal: PREVADIAB study. Diab Med 27(8): 879-881.
- He Y, Zhai F, Ma G, Feskens EJ, Zhang J, et al. (2009) Abdominal obesity and the prevalence of diabetes and intermediate hyperglycaemia in Chinese adults. Public Health Nutr 12(8):1078-1084.
- Guida B, Pietrobelli A, Trio R, Laccetti R, Falconi C, et al. (2008) Body mass índex and bioelectrical vector distribution in 8-year-old children. Nutr Metab Cardiovasc Dis 18(2): 133-141.
- Monteiro AB, Filho JF (2002) Analysis of the body composition: a revision of Methods. Rev Bras Cineantropom Desempenho Hum 4: 80-92.
- Lombard IL (2010) Male and female differences in variability with estimating body fat composition using skinfold calipers. J Chiro Med 9: 157-161.
- Cao D, Wu G, Zhang B, Quan YJ, Wei J, et al. (2010) Resting energy expenditure and body composition in patients with newly detected cancer. Clin Nutr 29(1): 72-77.
- Kyle UG, Bosaeus I, De Lorenzo AD, Deurenberg P, Elia M, et al. (2004) Bioelectrical impedance analysis-part II: utilization in clinical practice. Clin Nutr 23(6): 1430-1453.
- Lupoli L, Sergi G, Coin A, Perissinotto E, Volpato S, et al. (2004) Body composition in underweight elderly subjects: reliability of bioelectrical impedance analysis. Clin Nutr 23(6): 1371-1380.
- Tsui EYL, Gao XJ, Zinman B (1998) Bioelectrical Impedance Analysis (BIA) using bipolar foot electrodes in the assessment of body composition in type 2 diabetes mellitus. Diab Med 15(2): 125-128.
- Miyatani M, Yang P, Thomas S, Craven BC, Oh P (2012) Bioelectrical impedance and Dual-Energy X-Ray absorptiometry assessments of changes in body composition following exercise in patients with type 2 diabetes mellitus. J Obes ID 953060.
- Ritz P, Sallé A, Audran M Rohmer V (2007) Comparison of different methods to assess body composition of weight loss in obese and diabetic patients. Diabetes Res Clin Pract 77(3): 405-411.
- Meeuwsen S, Horgan GW, Elia M (2010) The relationship between BMI and percent body fat, measured by bioelectrical impedance, in a large adult sample is curvilinear and influenced by age and sex. Clin Nutr 29(5): 560-566.
- World Medical Association (2000) Declaration of Helsinki: Ethical principles for medical research involving human subjects.
- INSA IP, INE IP (2009) Instituto Nacional de Estatística. 4º Inquérito Nacional de Saúde 2005/2006. Lisboa.
- IPAQ scientific group (2005) Guidelines for Data Processing and Analysis of the International Physical Activity Questionnaire. Geneva.
- American Diabetes Association (2013) Standards of medical care in diabetes-2013. Diabetes Care 6(1): S11-S66.
- Lohman TG, Roche AF, Martorell R (1991) Anthropometric standardization reference manual. Human Kinetics Books, USA.
- World Health Organization (2011) Waist circumference and waist-hip ratio: report of a WHO expert consultation. Geneva, USA.
- World Health Organization (2000) Obesity: preventing and managing the global epidemic: report of a WHO expert consultation. Technical Report Series no. 894. Geneva.
- Lohman TG (1986) Applicability of body composition techniques and constants for children and youth. Exerc Sport Sci Rev 14: 325-357.
- Boileau RA, Lohman TG, Slaughter MH (1985) Exercise body composition in children and youth. Scand J Sports Sci 7(1): 17-27.
- Faulkner JA (1968) Physiology of swimming and diving, Academic Press, USA, pp. 415-446.
- Durnin JVGA, Womersley J (1974) Body fat assessed from total body density and its estimation from skinfold thickness: measurements on 481 men and women aged from 16 to 72 years. Br J Nutr 32(1): 77-97.
- Siri WE (1961) Body composition from fluid spaces and density: analysis of methods. In Techniques for Measuring Body Composition, pp. 223- 234.
- Deurenberg P, Westrate JA, Seidell JC (1991) Body mass index as a measure of body fatness: age- and sex-specific prediction formulas. Br J Nutr 65(2): 105-114.
- Deurenberg P, Yap M, Van Staveren WA (1998) Body mass index and percent body fat. A meta-analysis among different ethnic groups. Int J Obes Relat Metab Disord 22(12): 1164-1171.
- Gallagher D, Visser M, Sepulveda D, Pierson RN, Harris T, et al. (1996) How useful is body mass index for comparison of body fatness across age, sex and ethnic groups. Am J Epidemiol 143(3): 228-239.
- Jackson AS (1984) Research design and analysis of data procedures for predicting body density. Med Sci Sports Exercise 16(6): 616-620.
- Jackson AS, Stanforth PR, Gagnon J. (2002) The effect of sex, age and race on estimating percentage body fat from body mass index: The Heritage Family Study. Int J Obes Relat MetabDisord 26(6): 789-796.
- European Food Safety Authority (EFSA)(2010) Scientific opinion on dietary reference values for water. EFSA J 8(3):1459-1507.
- Gomes MB, Neto DG, Mendonça E, Tambascia MA, Fonseca RM, et al. (2006) Nationwide multicenter study on the prevalence of overweight and obesity in type 2 diabetes mellitus in the Brazilian population. Arq Bras Endocrinol Metab 50(1): 136-144.
- World Health Organization (1995) Physical Status: The Use and Interpretation of Anthropometry. Technical Report Series no. 854, Geneva, USA.
- Lohman TG (1981) Skinfolds and body density and their relation to body fatness: a review. Hum Biol 53(2): 181-225.
- Yusuf S, Hawken S, Ounpuu S, Dans T, Avezum A, et al. (2004) Effect of potentially modifiable risk factors associated with myocardial infarction in 52 countries (the INTERHEART study): case-control study. Lancet 364(3998): 937-952.
- Segal KR, Burastero S, Chun A, Coronel P, Pierson RN, et al. (1991) Estimation of extracellular and total body water by multiplefrequency bioelectrical-impedance measurement. Am J Clin Nutr 54(1): 26-29.
- Lainscaka M, Keberb I, Ankerc SD (2006) Body composition changes in patients with systolic heart failure treated with beta blockers: A pilot study. Int J Cardiol 106(3): 319-322.
- Daousi C, Casson IF, Gill GV, MacFarlane IA, Wilding JP, et al. (2006) Prevalence of obesity in type 2 diabetes in secondary care: association with cardiovascular risk factors. Postgrad Med J 82(966): 280-284.
- Kamath A, Shivaprakash G, Adhikari P (2011) Body mass index and Waist circumference in Type 2 Diabetes mellitus patients attending a diabetes clinic. Int J Biol Med Res 2(3): 636-638.
- Poljičanin T, Pavlić-Renar I, Metelko Ž (2011) Obesity in type 2 diabetes: prevalence, treatment trends and dilemmas. Coll Antropol 35(3): 829- 834.
- Gómez-Ambrosi J, Silva C, Galofré JC et al. (2011) Body adiposity and type 2 diabetes: increased risk with a high body fat percentage even having a normal BMI. Obesity 19(7): 1439-1444.
Article Type
Research Article
Publication history
Received date: September 18, 2019
Published date: October 30, 2019
Address for correspondence
Ana Valente, Atlântica-Escola Universitária de Ciências Empresariais, Saúde, Tecnologias e Engenharia, Fábrica da Pólvora de Barcarena, Barcarena, Portugal
Copyright
©2019 Open Access Journal of Biomedical Science, All rights reserved. No part of this content may be reproduced or transmitted in any form or by any means as per the standard guidelines of fair use. Open Access Journal of Biomedical Science is licensed under a Creative Commons Attribution 4.0 International License
How to cite this article
Ana V, Manuel B, Rui Duarte, João Filipe R. Body Composition and Different Criteria for Obesity Evaluation in Type 2 Diabetic Patients with and Without Angiopathy. 2019 - 1(2) OAJBS.ID.000111.
Figure 1: Bland-Altman analysis to compare body fat percentage estimated by anthropometric equations and bioimpedance analysis (BIA) method. Bland-Altman plots show comparisons of BIA method with Lohman (a), Boileau (b), Faulkner (c), Deurenberg (1991) (d), Deurenberg (1998) (e), Gallagher (f), Jackson & Pollock (g), Heritage study (h) and Siri (i) anthropometric equations. Central lines represent mean difference between methods. Dashed lines correspond to upper and lower limits of agreement at 95% confidence interval calculated by mean of total error ± 1.96 x. standard deviation of the total error.
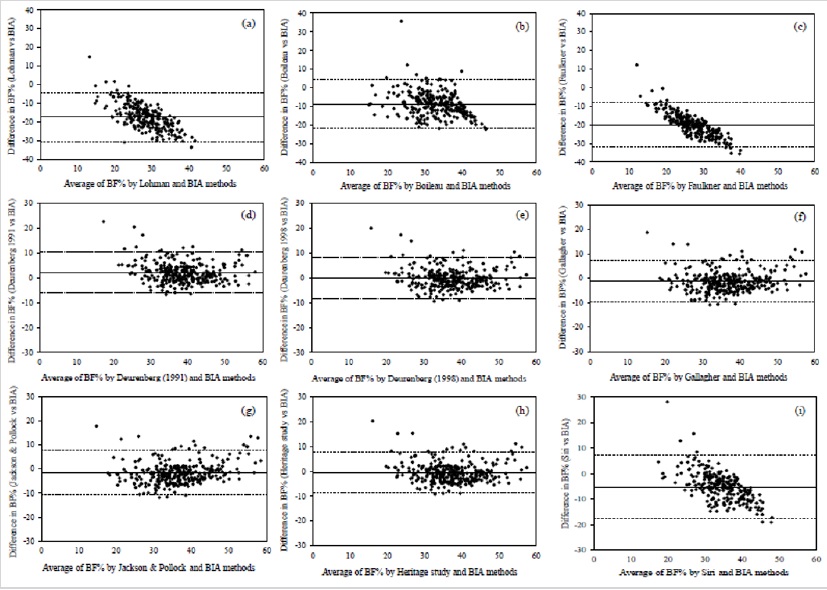
Table 1: Baseline clinical and laboratory characteristics of the study population.
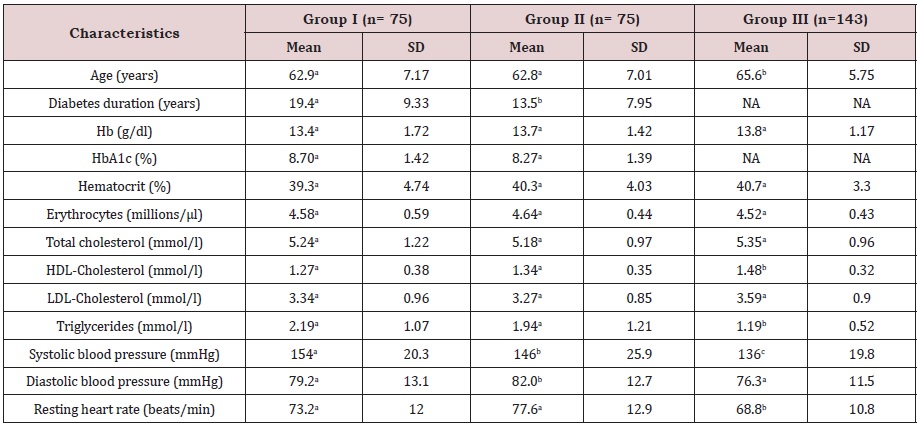
NA: not applicable; Hb: haemoglobin; HbA1c: Glycosylated haemoglobin; HDL: High-density lipoprotein; LDL: low-density lipoprotein. Means in a row with different superscript letters are significantly different by post hoc Bonferroni test (P<0.05).
Table 2: Prevalence of angiopathic complications and cardiovascular risk factors.
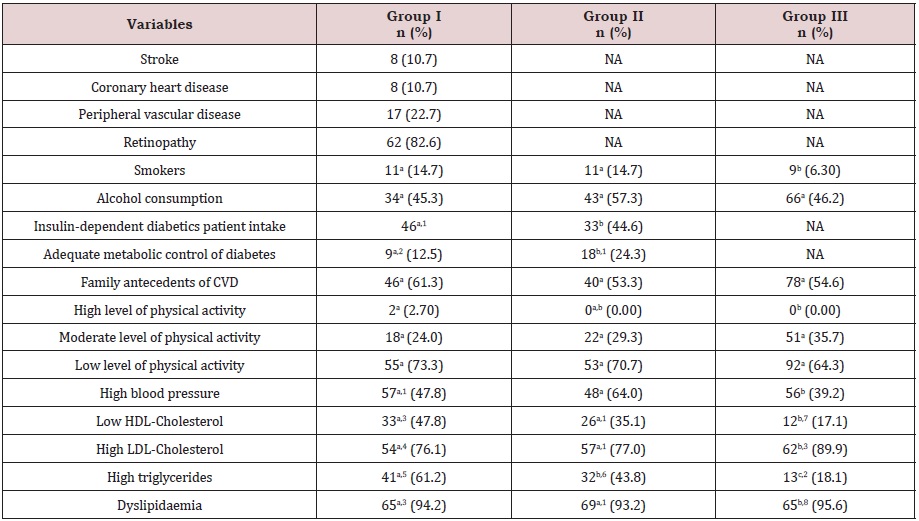
NA: not applicable; CVD: cardiovascular disease; HDL: high-density lipoprotein; LDL: low-density lipoprotein.
The number of subjects in a row with different superscript letters are significantly different by z-test for proportions (P<0.05). n1= 74; n2= 72; n3 = 69; n4 = 71; n5 = 67; n6 = 73; n7 = 70; n8 = 68
Table 3: Anthropometric and bioelectrical impedance data in the three study groups.
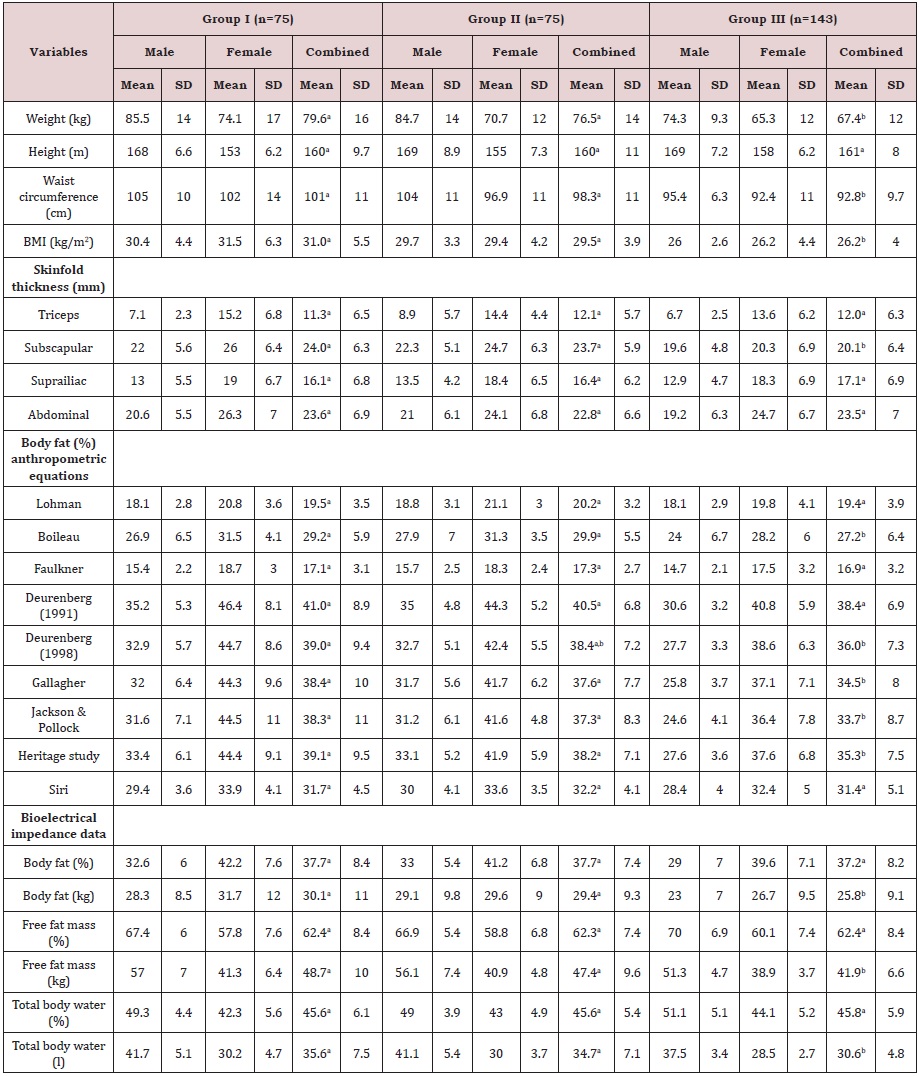
Table 4: Obesity evaluation by different methods (BMI, waist circumference and body fat percentage).

BMI; Body mass index BIA, bioelectrical impedance.
The number of subjects in a row with different superscript letters are significantly different by z-test for proportions (P<0.05).
Table 5: Comparison between anthropometric equations and BIA to evaluate validity of body fat percentage measurements.